May 1
May 10
May 19
May 28
Jun 6
Jun 15
Jun 24
Jul 3
Jul 12
Jul 21
Jul 30
Aug 8
Aug 17
Aug 26
Sep 4
Sep 13
Sep 22
Oct 1
Oct 10
Oct 19
Oct 28
Nov 6
Nov 15
Nov 24
Dec 3
Dec 12
Dec 21
Dec 30
0
500
1000
1500
2000
2500
3000
3500
4000
4500
5000
5500
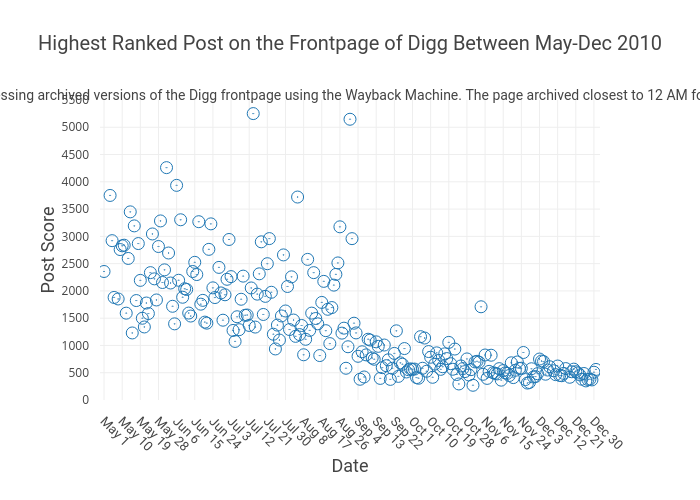
Highest Ranked Post on the Frontpage of Digg Between May-Dec 2010
Date
Post Score
Scores where gathered by accessing archived versions of the Digg frontpage using the Wayback Machine. The page archived closest to 12 AM for each given day was selected.
plotly-logomark
Edit chart
Lemmino's interactive graph and data of "Highest Ranked Post on the Frontpage of Digg Between May-Dec 2010" is a scatter chart, showing C; with Date in the x-axis and Post Score in the y-axis.. The x-axis shows values from -2 to 246. The y-axis shows values from 0 to 5500. This visualization has the following annotation: Scores where gathered by accessing archived versions of the Digg frontpage using the Wayback Machine. The page archived closest to 12 AM for each given day was selected.