2010
2011
2012
2013
2014
0
1
2
3
4
5
6
7
8
9
10
11
12
13
14
15
16
17
18
19
20
21
22
23
24
25
26
27
28
29
30
31
32
33
34
35
36
37
38
39
40
41
42
43
44
45
46
47
48
49
50
51
52
53
54
55
56
57
58
59
60
61
62
63
64
65
66
67
68
69
70
71
72
73
74
75
76
77
78
79
80
81
82
83
84
85
86
87
88
89
90
91
92
93
94
95
96
97
98
99
100
101
102
103
104
105
106
107
108
109
110
111
112
113
114
115
116
117
118
119
120
121
122
123
124
125
126
127
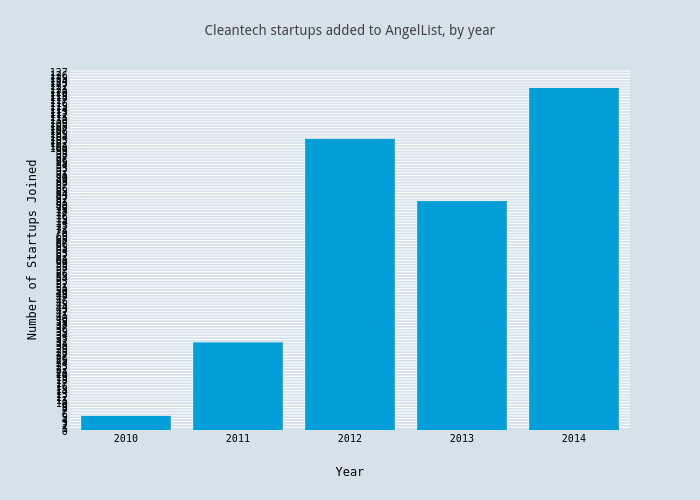
Cleantech startups added to AngelList, by year
Year
Number of Startups Joined
plotly-logomark
Edit chart
Katie_straub's interactive graph and data of "Cleantech startups added to AngelList, by year" is a bar chart, showing Col2; with Year in the x-axis and Number of Startups Joined in the y-axis.. The x-axis shows values from 2009.5 to 2014.5. The y-axis shows values from 0 to 127.36842105263158.