May 28
2017
Jun 11
Jun 25
Jul 9
Jul 23
Aug 6
Aug 20
48
50
52
54
56
58
60
62
64
66
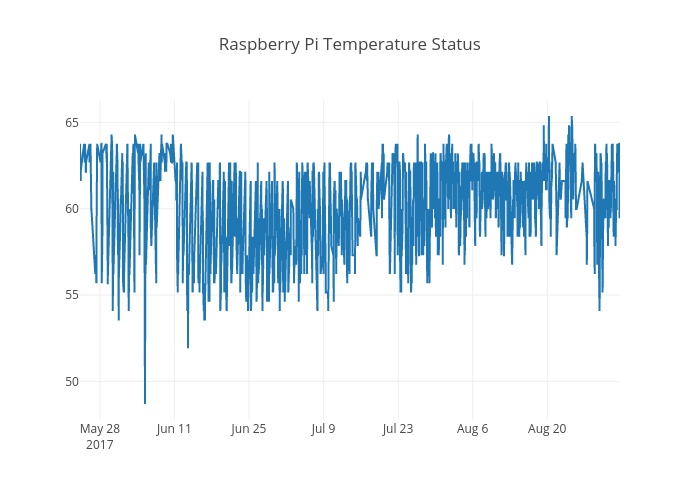
Raspberry Pi Temperature Status
plotly-logomark
Edit chart
Dingsk's interactive graph and data of "Raspberry Pi Temperature Status" is a scatter chart, showing y. The x-axis shows values from 0 to 0. The y-axis shows values from 0 to 0.