500
1000
1500
2000
2500
3000
3500
4000
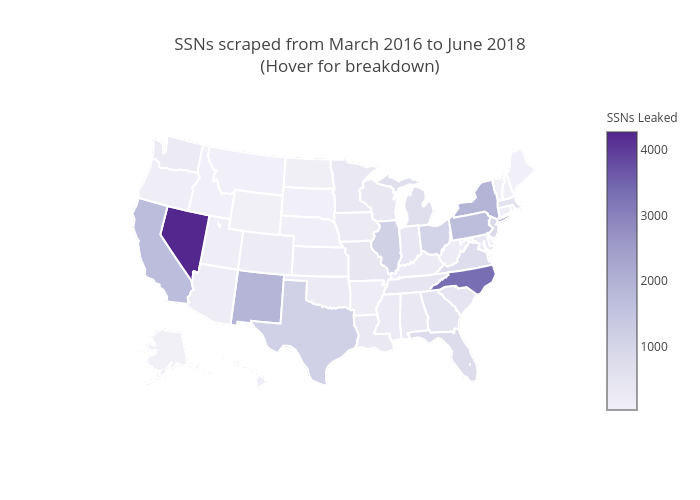
SSNs Leaked
SSNs scraped from March 2016 to June 2018
(Hover for breakdown)
plotly-logomark
Edit chart
Loading graph
Danscrapy's interactive graph and data of "SSNs scraped from March 2016 to June 2018(Hover for breakdown)" is a choropleth. The x-axis shows values from 0 to 0. The y-axis shows values from 0 to 0.