6/30/18
7/12/18
7/24/18
8/5/18
8/17/18
8/29/18
9/10/18
9/22/18
10/4/18
10/16/18
10/28/18
11/9/18
11/21/18
12/3/18
12/15/18
12/27/18
1/8/19
1/20/19
2/1/19
2/13/19
2/25/19
3/9/19
3/21/19
4/2/19
4/14/19
4/26/19
5/8/19
5/20/19
6/1/19
6/13/19
6/25/19
7/7/19
7/19/19
7/31/19
8/12/19
8/24/19
9/5/19
9/17/19
9/29/19
10/11/19
10/23/19
11/4/19
11/16/19
11/28/19
12/10/19
12/22/19
1/3/20
1/15/20
1/27/20
2/8/20
2/20/20
3/3/20
3/15/20
3/27/20
4/8/20
4/20/20
5/2/20
5/14/20
5/26/20
6/7/20
6/19/20
7/1/20
7/13/20
7/25/20
0
0.05
0.1
0.15
0.2
0.25
0.3
Potatoes ET
Pines ET
Daily ET (inches)
plotly-logomark
Edit chart
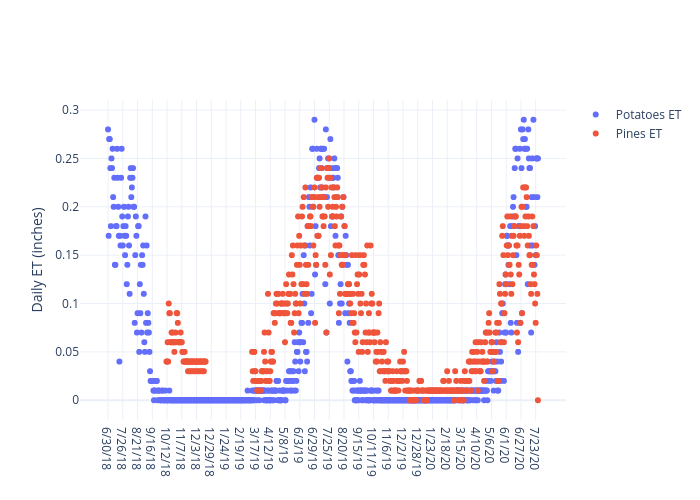
Centralsandswi's interactive graph and data of "Potatoes ET vs Pines ET" is a scatter chart, showing Potatoes ET vs Pines ET; with Daily ET (inches) in the y-axis. The x-axis shows values from -46.26080672710551 to 804.2608067271055. The y-axis shows values from -0.021362451108213817 to 0.3113624511082138.