1980
1985
1990
1995
2000
2005
2010
2015
0
100
200
300
400
500
600
Conflict
Assault
Accusations
Diplomacy
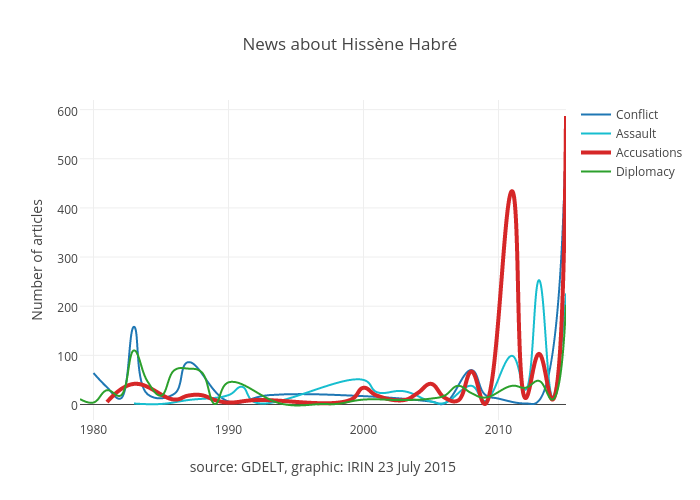
News about Hissène Habré
source: GDELT, graphic: IRIN 23 July 2015
Number of articles
plotly-logomark
Edit chart
Benparker140's interactive graph and data of "News about Hissène Habré" is a line chart, showing Conflict, Assault, Accusations, Diplomacy; with source: GDELT, graphic: IRIN 23 July 2015 in the x-axis and Number of articles in the y-axis.. The x-axis shows values from 1979 to 2015. The y-axis shows values from -31.555555555555557 to 619.5555555555555.