5
10
15
20
−0.1
−0.05
0
0.05
0.1
0.15
plotly-logomark
Edit chart
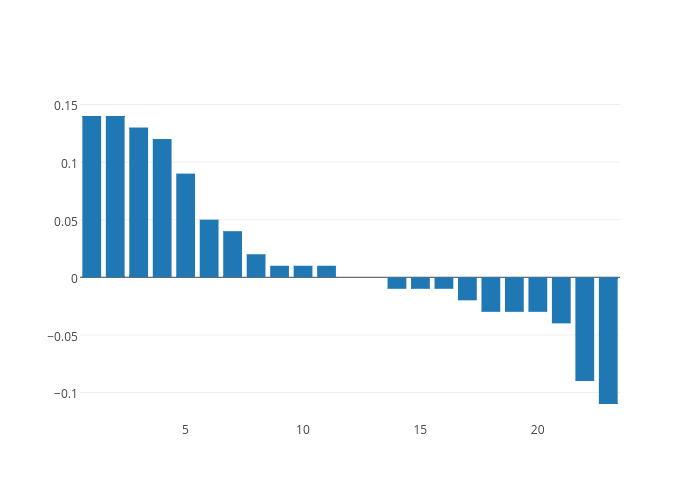
Artem.kolesnik's interactive graph and data of "Col2" is a bar chart, showing Col2. The x-axis shows values from 0.5 to 23.5. The y-axis shows values from -0.1238888888888889 to 0.1538888888888889.