0
5
10
15
20
0
2
4
6
8
10
12
plotly-logomark
Edit chart
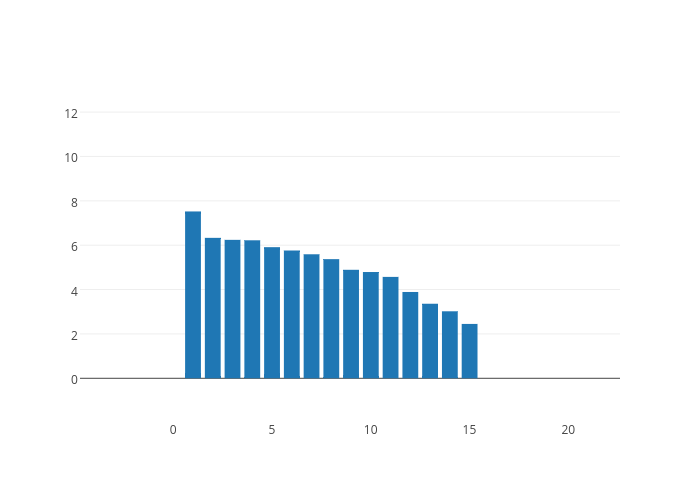
Artem.kolesnik's interactive graph and data of "Col2" is a bar chart, showing Col2. The x-axis shows values from -4.719734015656268 to 22.612047990201336. The y-axis shows values from -1.8801235430893115 to 12.543385276843964.