1
2
3
4
5
6
0
1
2
3
4
5
6
plotly-logomark
Edit chart
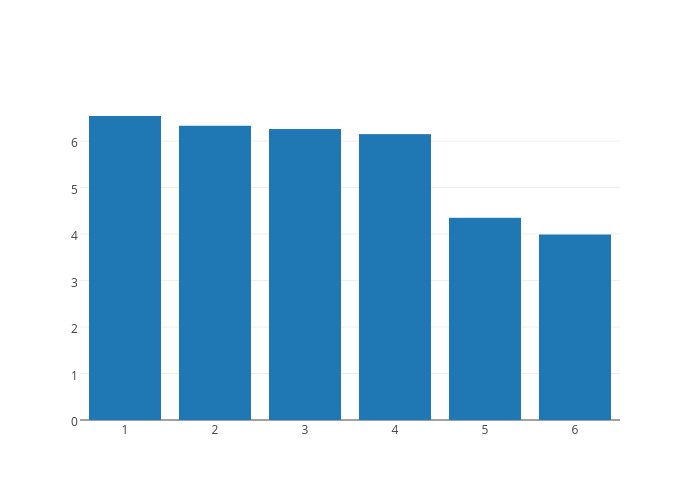
Artem.kolesnik's interactive graph and data of "Col2" is a bar chart, showing Col2. The x-axis shows values from 0.5 to 6.5. The y-axis shows values from 0 to 6.88421052631579.