5
10
15
20
0
1
2
3
4
5
6
7
8
plotly-logomark
Edit chart
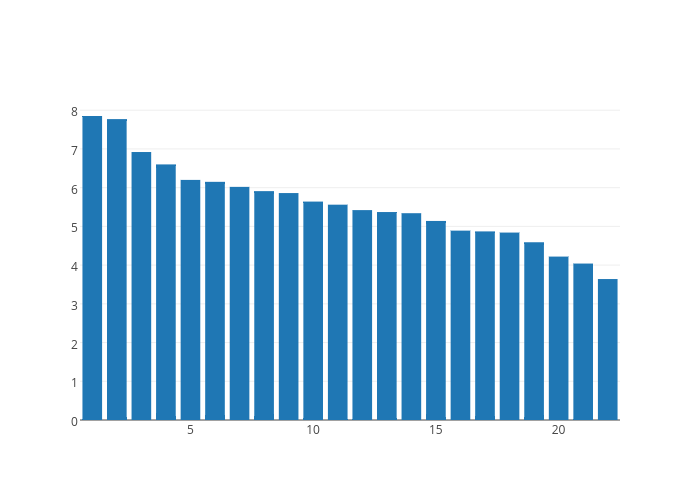
Artem.kolesnik's interactive graph and data of "Col2" is a bar chart, showing Col2. The x-axis shows values from 0.5 to 22.5. The y-axis shows values from 0 to 8.263157894736842.