5
10
15
20
0
0.05
0.1
0.15
0.2
0.25
plotly-logomark
Edit chart
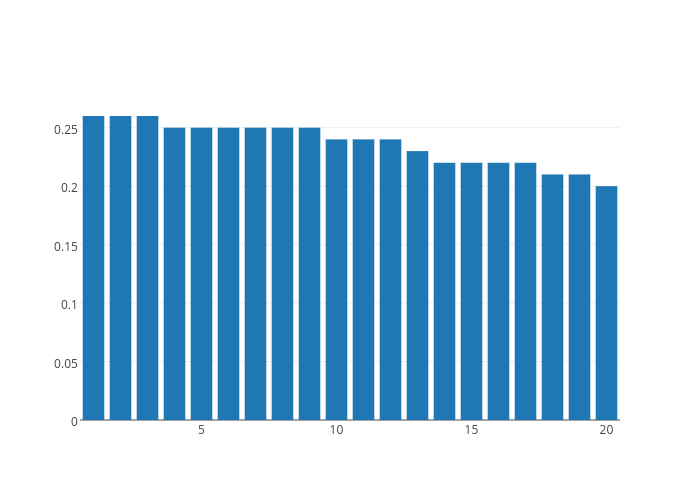
Artem.kolesnik's interactive graph and data of "Col2" is a bar chart, showing Col2. The x-axis shows values from 0.5 to 20.5. The y-axis shows values from 0 to 0.2736842105263158.