2238
12415
7277
4095
3566
1383
1448
9227
7363
3592
2214
1348
18-24
25-34
35-44
45-54
55-64
65+
MEN
vs
WOMEN
plotly-logomark
Edit chart
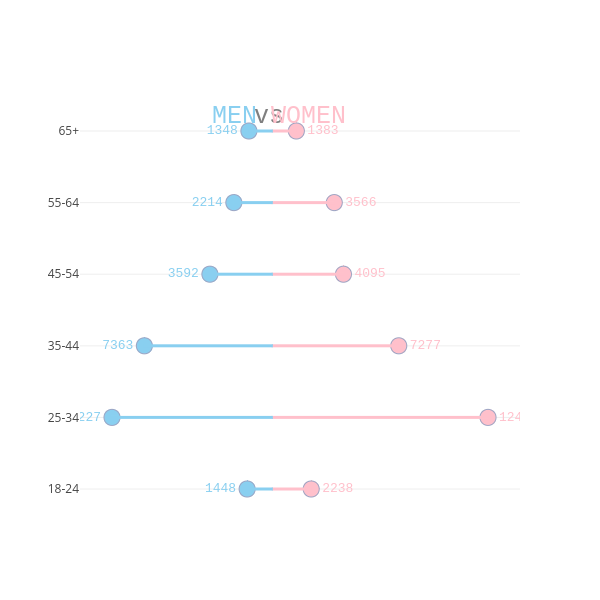
Alecseo's interactive graph and data is a . The x-axis shows values from 0 to 0. The y-axis shows values from 0 to 0. This visualization has the following annotations: MEN; vs; WOMEN