ALL_VISITS
Sessions with Product Views
Sessions with Add to Cart
Sessions with Check-Out 1
Sessions with Check-Out 2
Sessions with Transactions
plotly-logomark
Edit chart
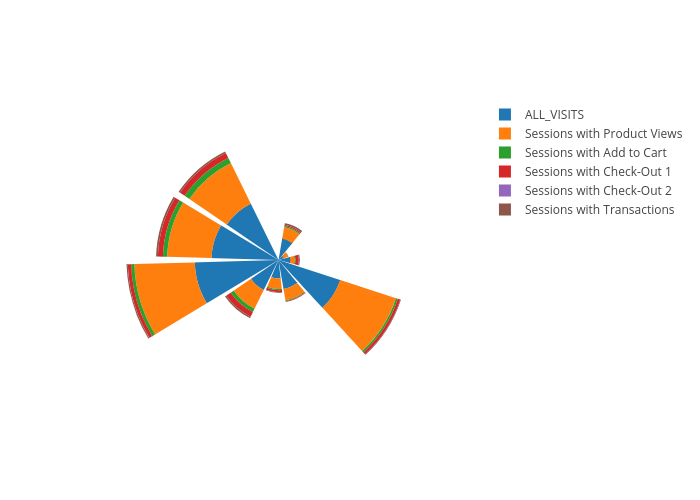
Alecseo's interactive graph and data of "ALL_VISITS, Sessions with Product Views, Sessions with Add to Cart, Sessions with Check-Out 1, Sessions with Check-Out 2, Sessions with Transactions" is a barpolar, showing ALL_VISITS, Sessions with Product Views, Sessions with Add to Cart, Sessions with Check-Out 1, Sessions with Check-Out 2, Sessions with Transactions. The x-axis shows values from 0 to 0. The y-axis shows values from 0 to 0.