Aug 14
2022
Aug 28
Sep 11
Sep 25
Oct 9
Oct 23
Nov 6
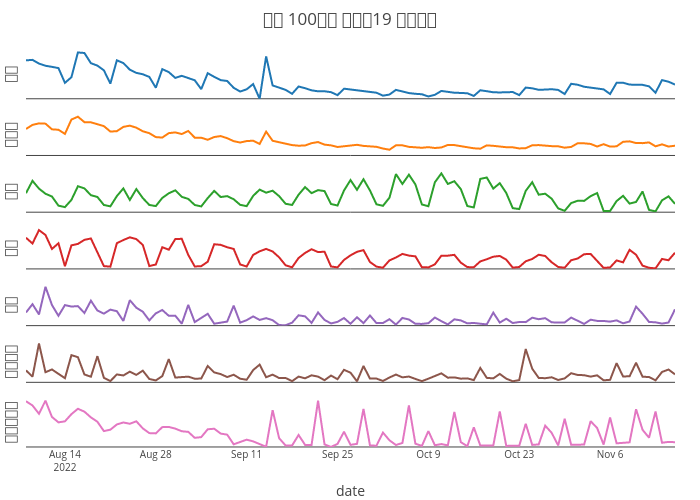
최근 100일간 코로나19 확진자수
date
한국
아시아
유럽
북미
남미
아프리카
오세아니아
plotly-logomark
Edit chart
2stndard's interactive graph and data of "최근 100일간 코로나19 확진자수" is a line chart, showing 한국, 아시아, 유럽, 북미, 남미, 아프리카, 오세아니아; with date in the x-axis and 한국 in the y-axis.. The x-axis shows values from 0 to 0. The y-axis shows values from 0 to 0.