education
junk (noise)
digital data
architecture
global economics
emotion
design
family
space
physics
society
disease biology
war politics
medicine
intelligent technology
environment
marine biology
neuroscience
agriculture
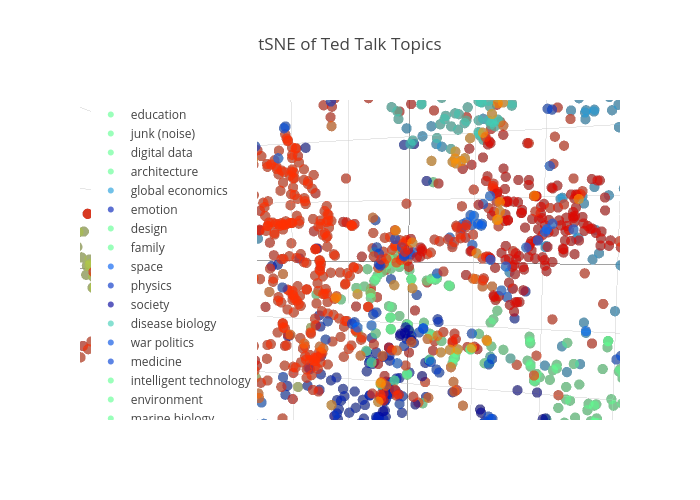
tSNE of Ted Talk Topics
plotly-logomark
Edit chart
1fmusic's interactive graph and data of "tSNE of Ted Talk Topics" is a scatter3d, showing 2; with 0 in the x-axis and 1 in the y-axis.. The x-axis shows values from 0 to 0. The y-axis shows values from 0 to 0.