GGPLOT - geom_bar
Create bar chart and then convert them with ggplotly.
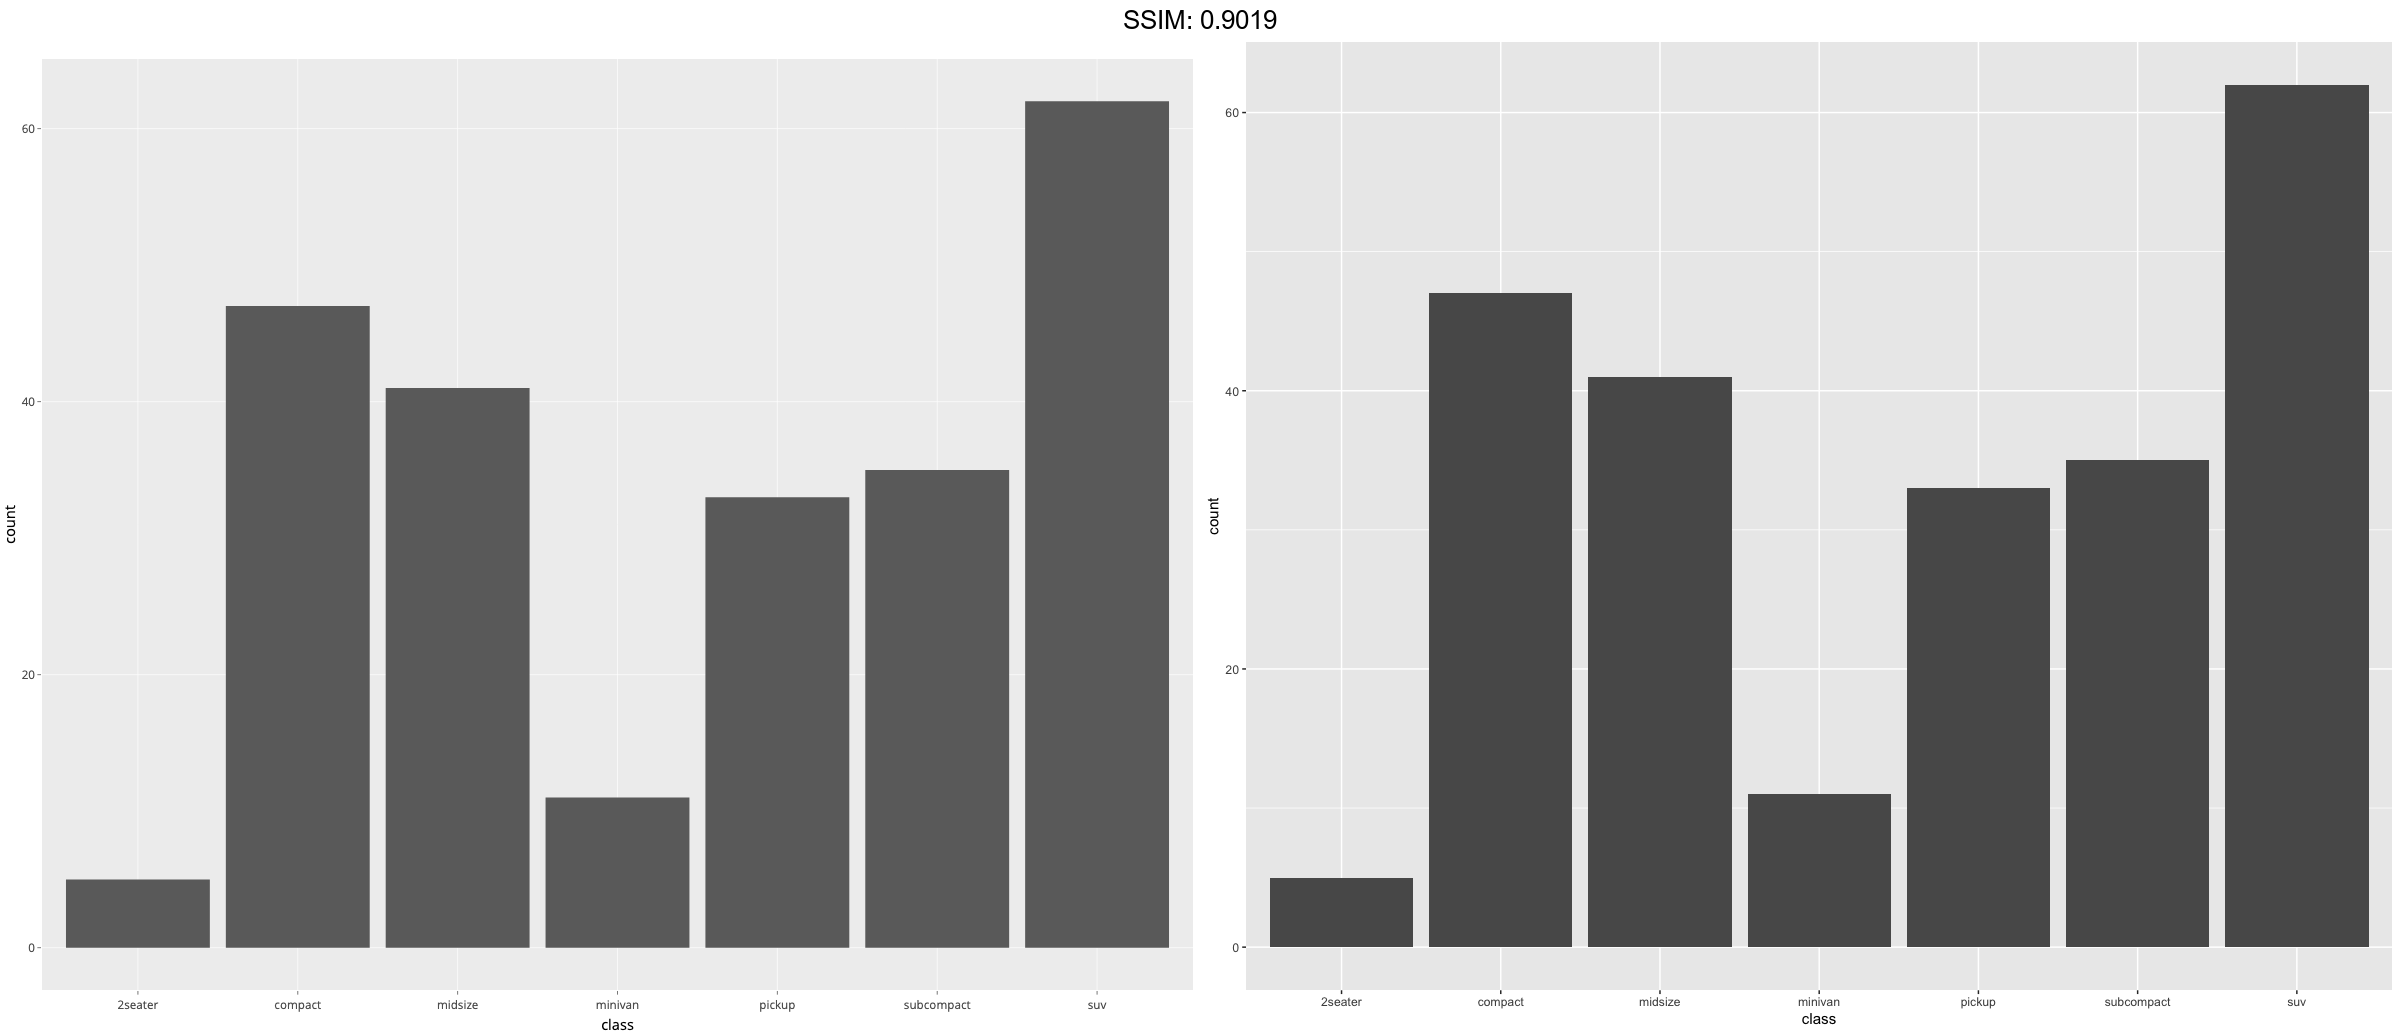
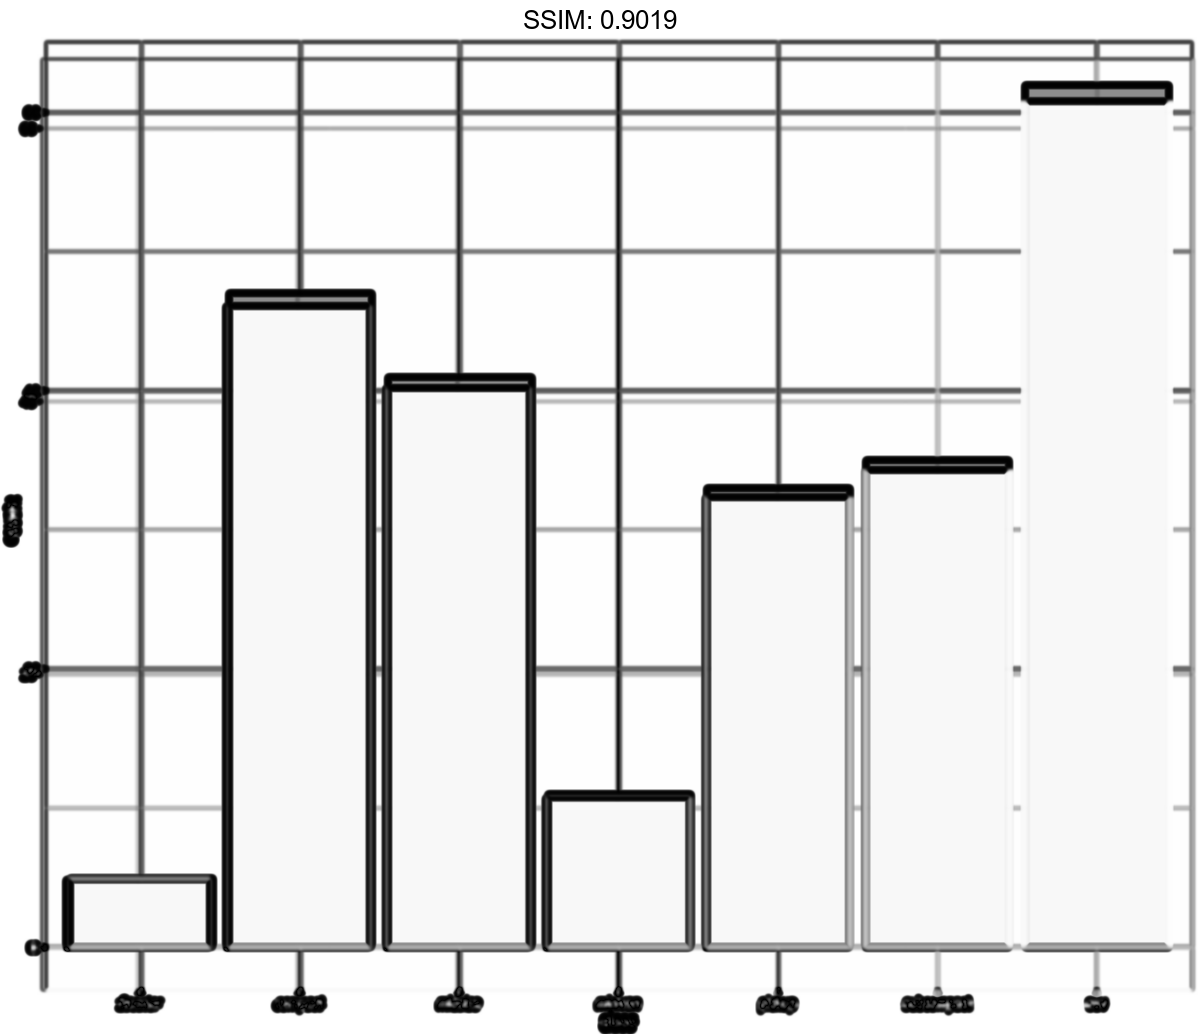
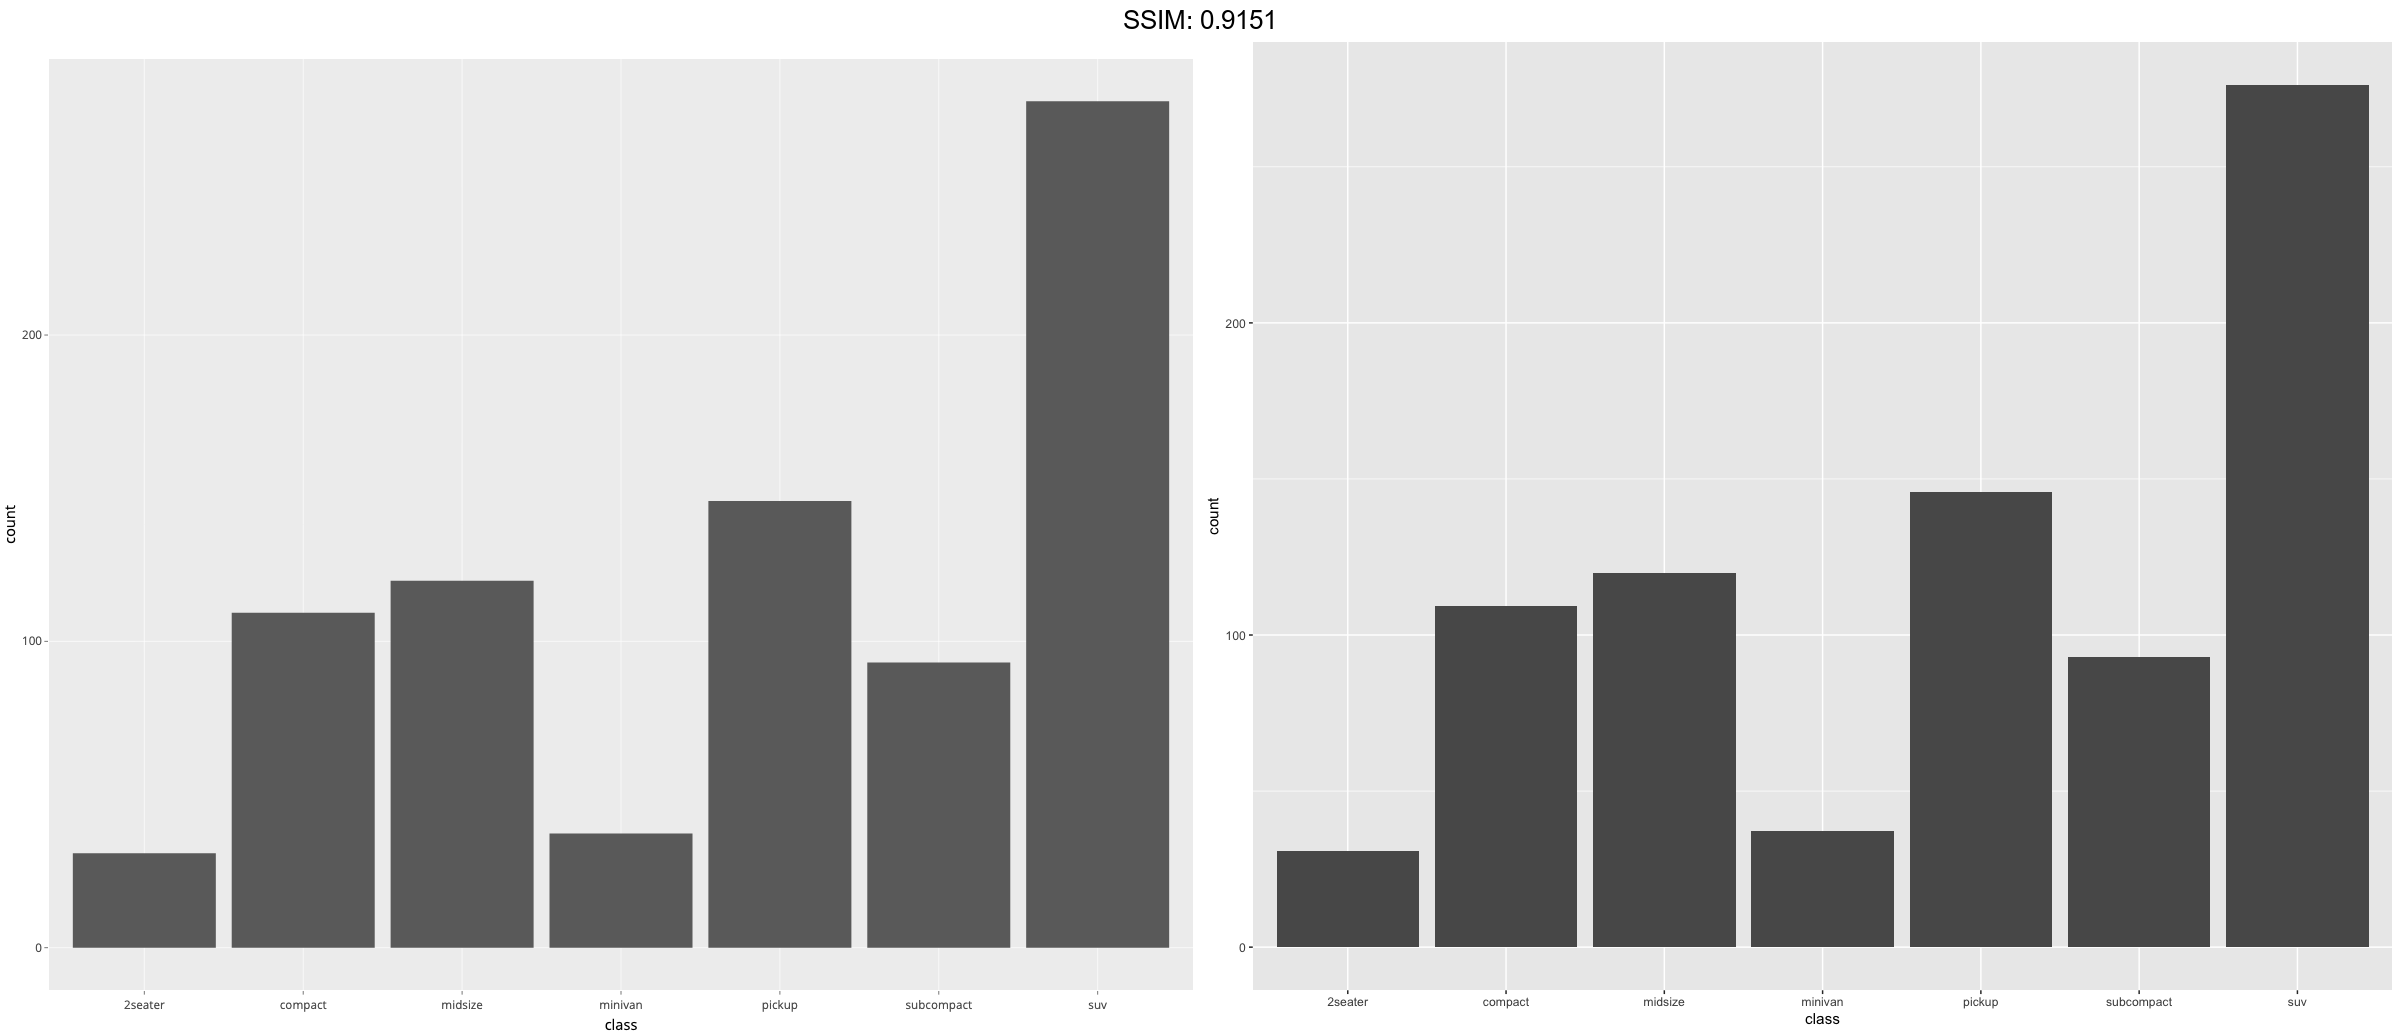
g <- ggplot(mpg, aes(class))
p <-  g + geom_bar()
plotly::ggplotly(p)

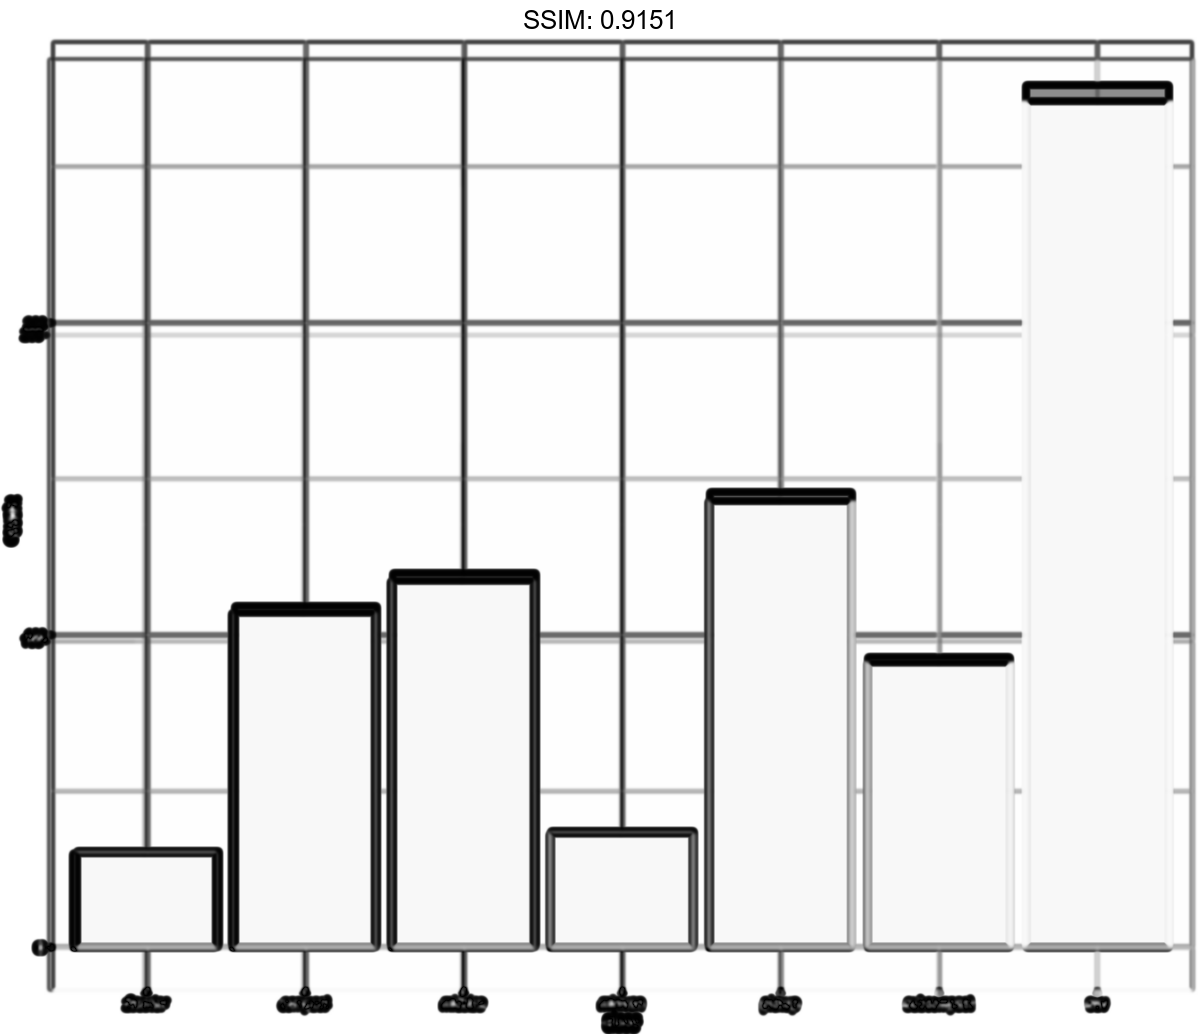
g <- ggplot(mpg, aes(class))
p <-  g + geom_bar(aes(weight = displ))
plotly::ggplotly(p)
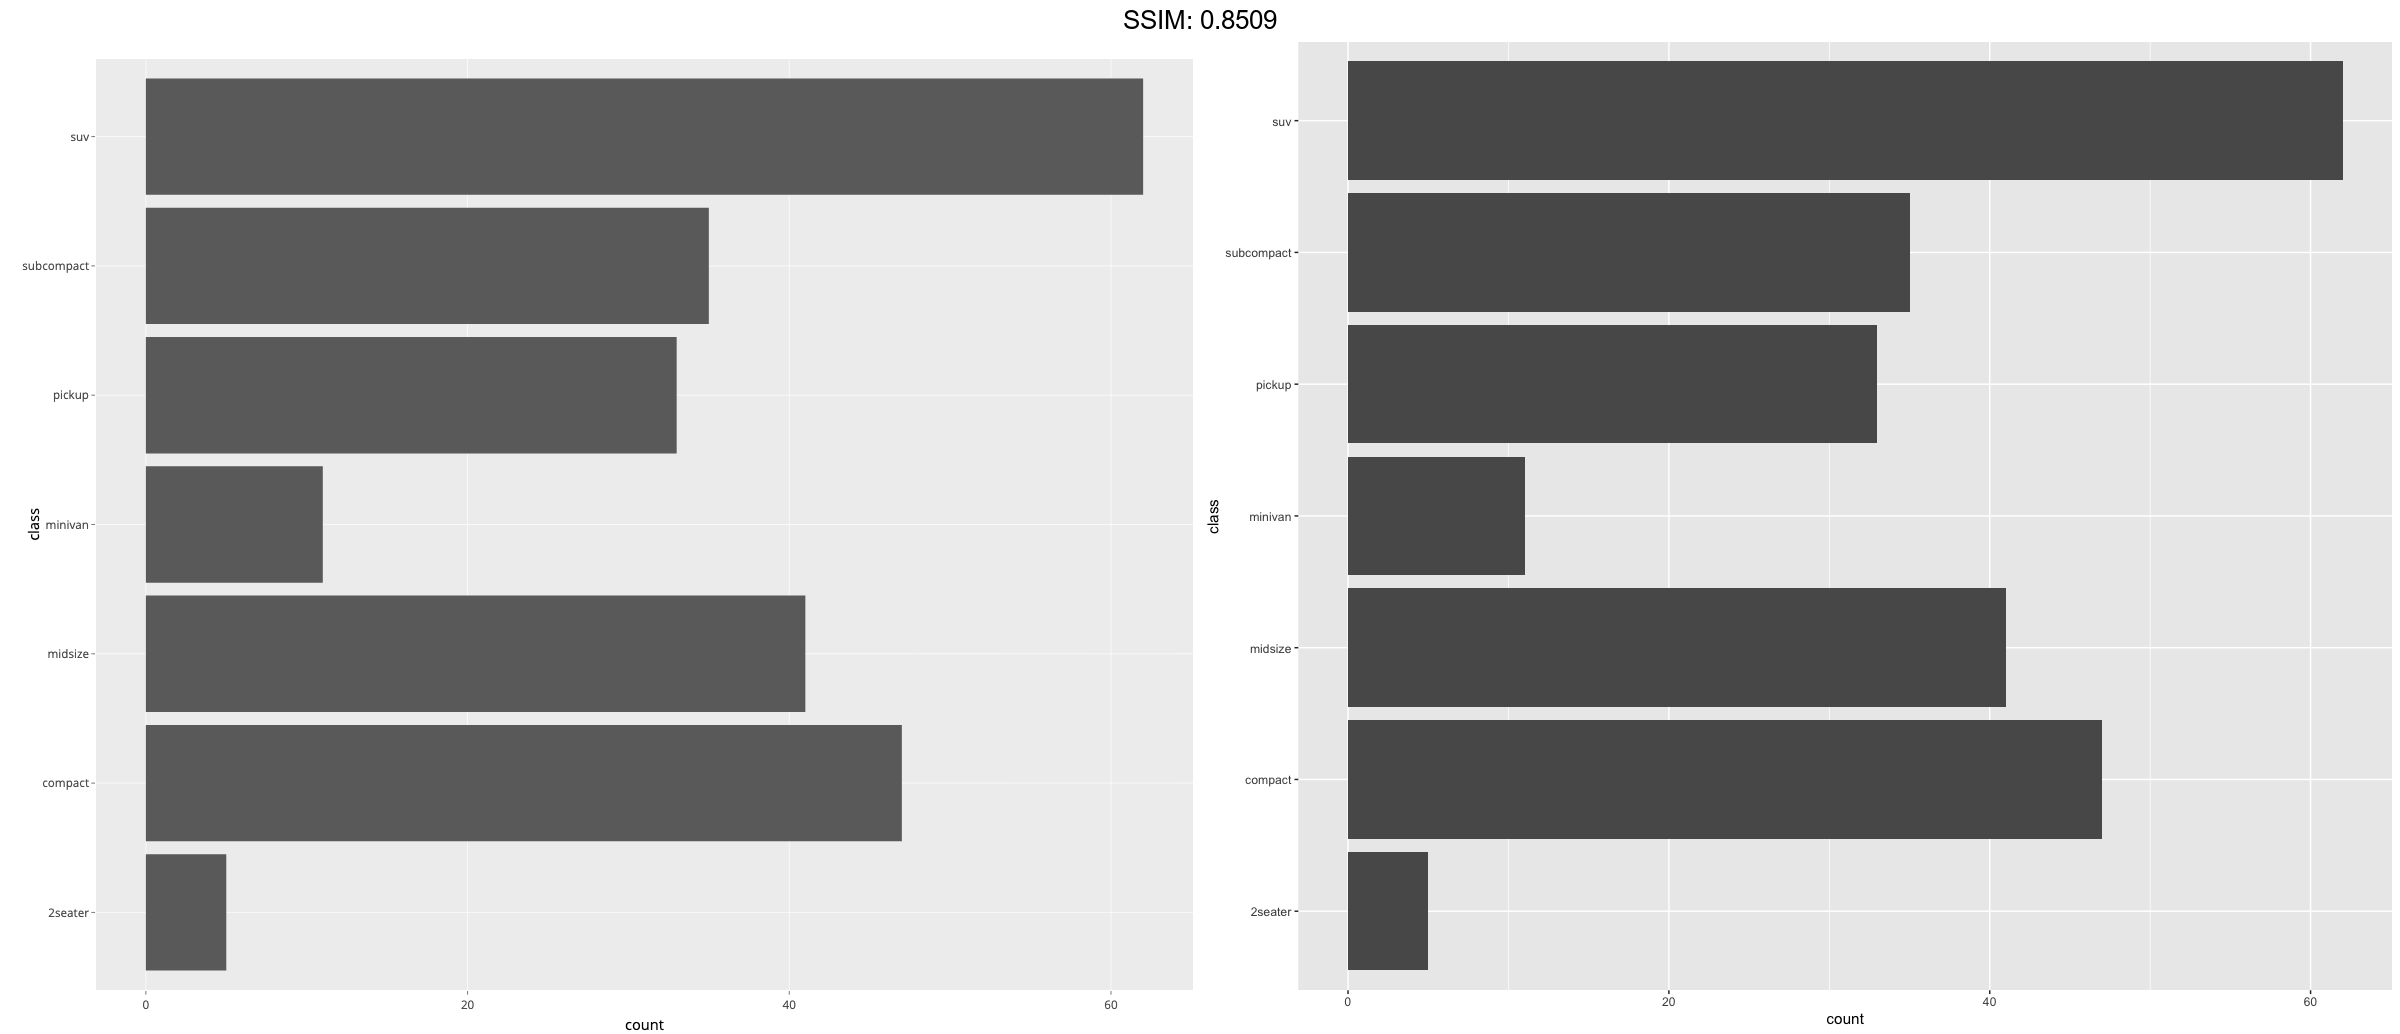
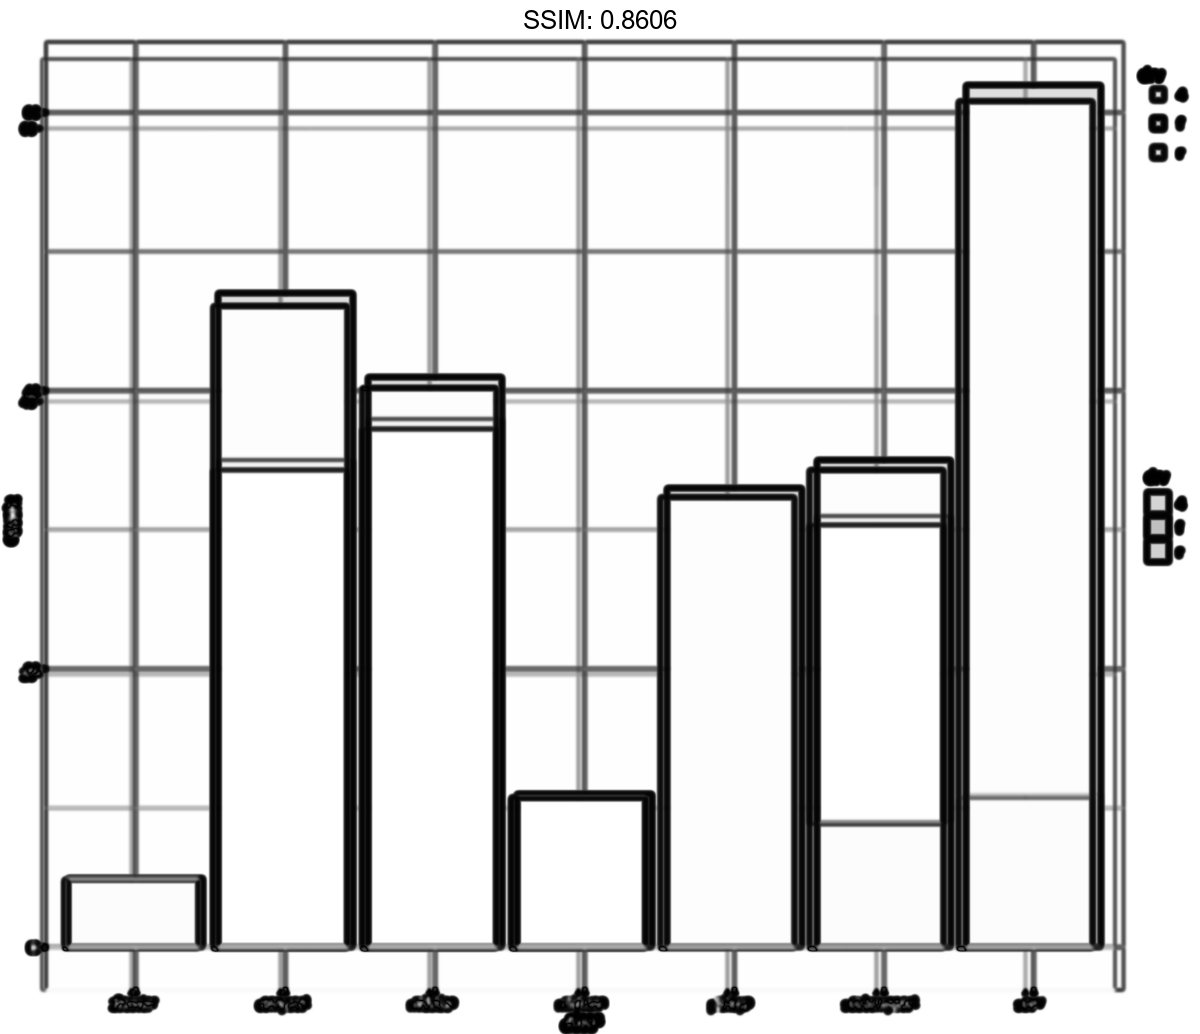
g <- ggplot(mpg, aes(class))
p <-  ggplot(mpg) + geom_bar(aes(y = class))
plotly::ggplotly(p)

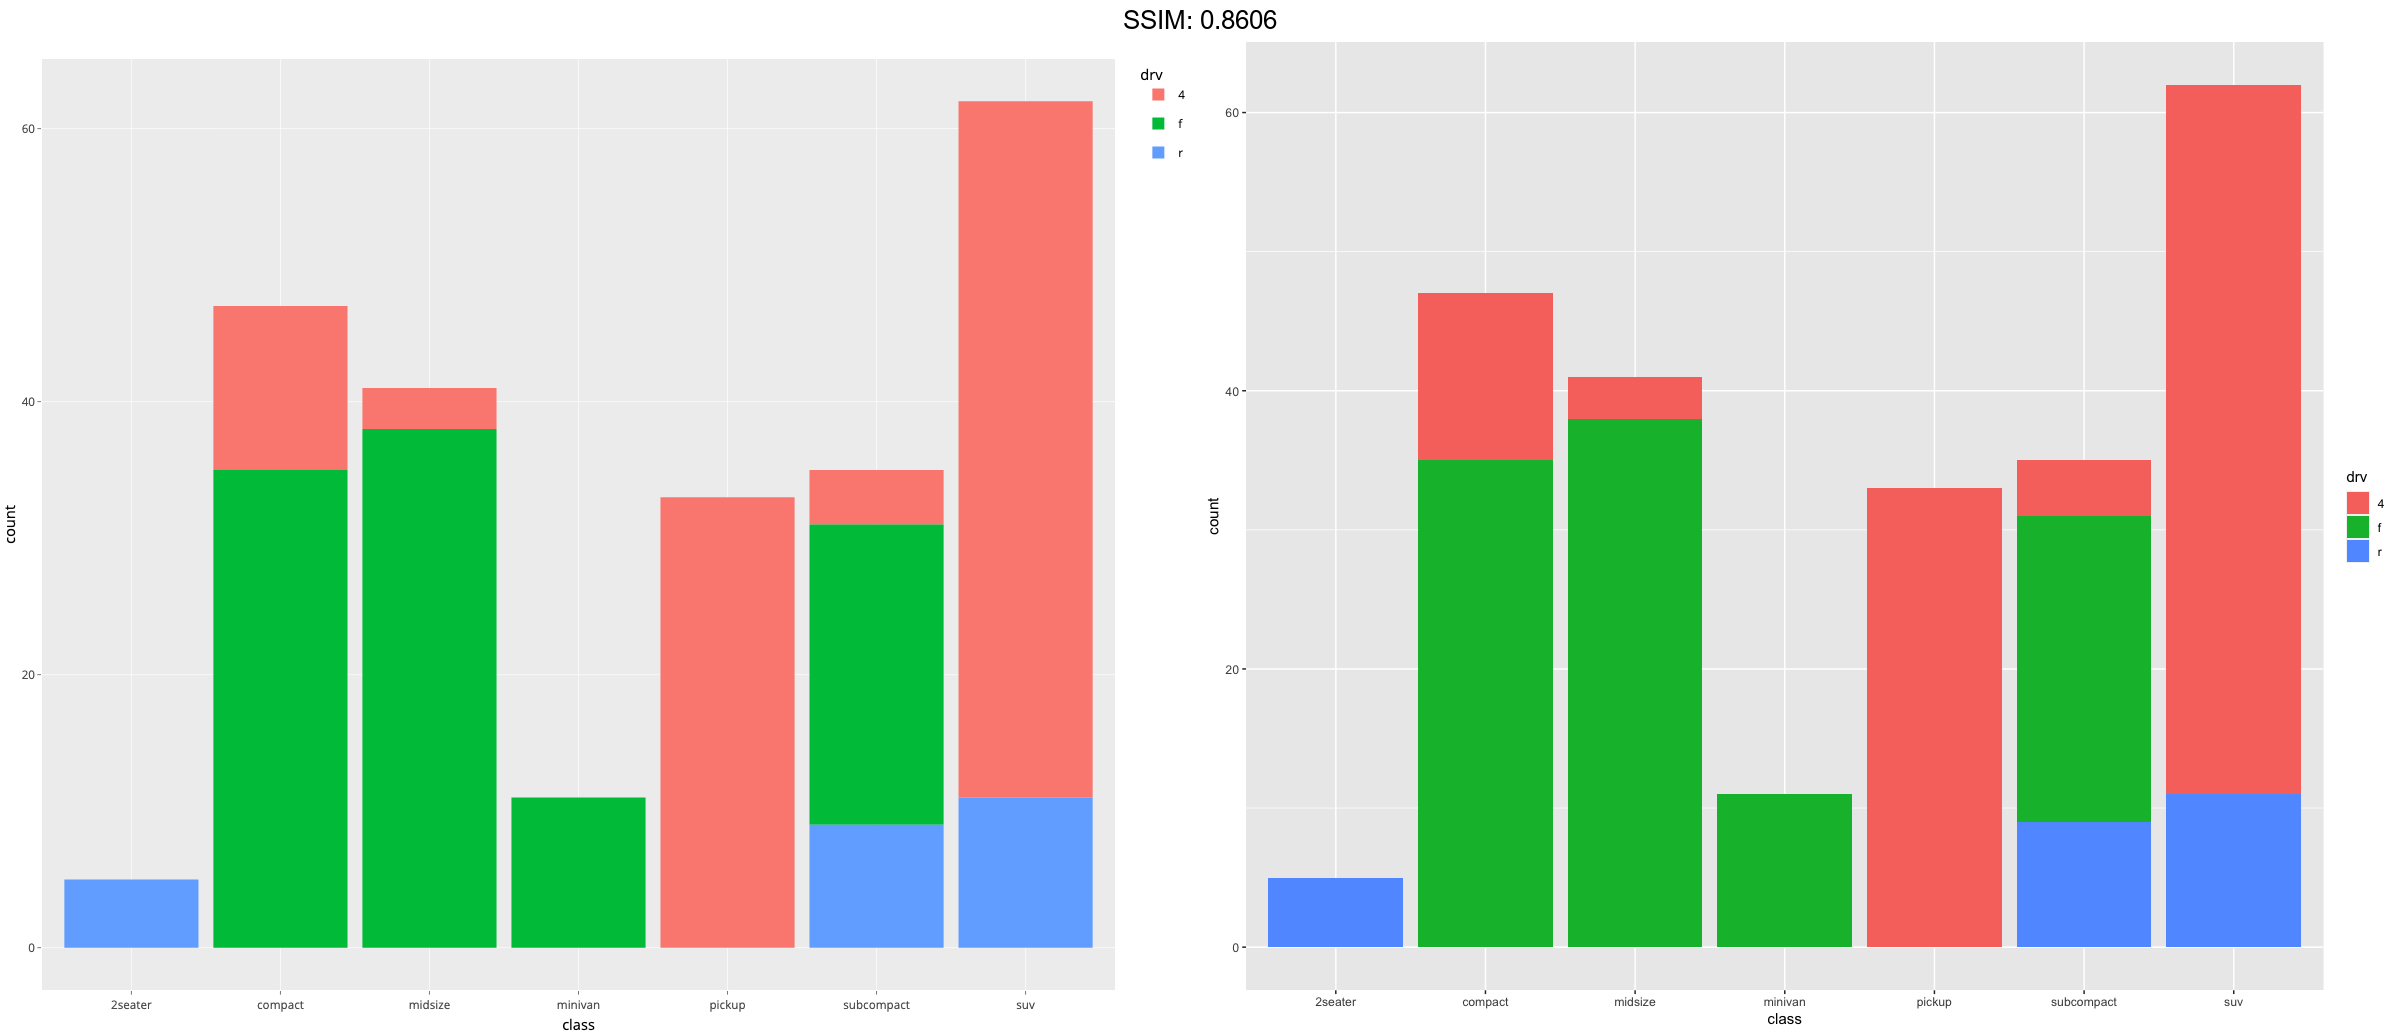
g <- ggplot(mpg, aes(class))
p <-  g + geom_bar(aes(fill = drv))
plotly::ggplotly(p)
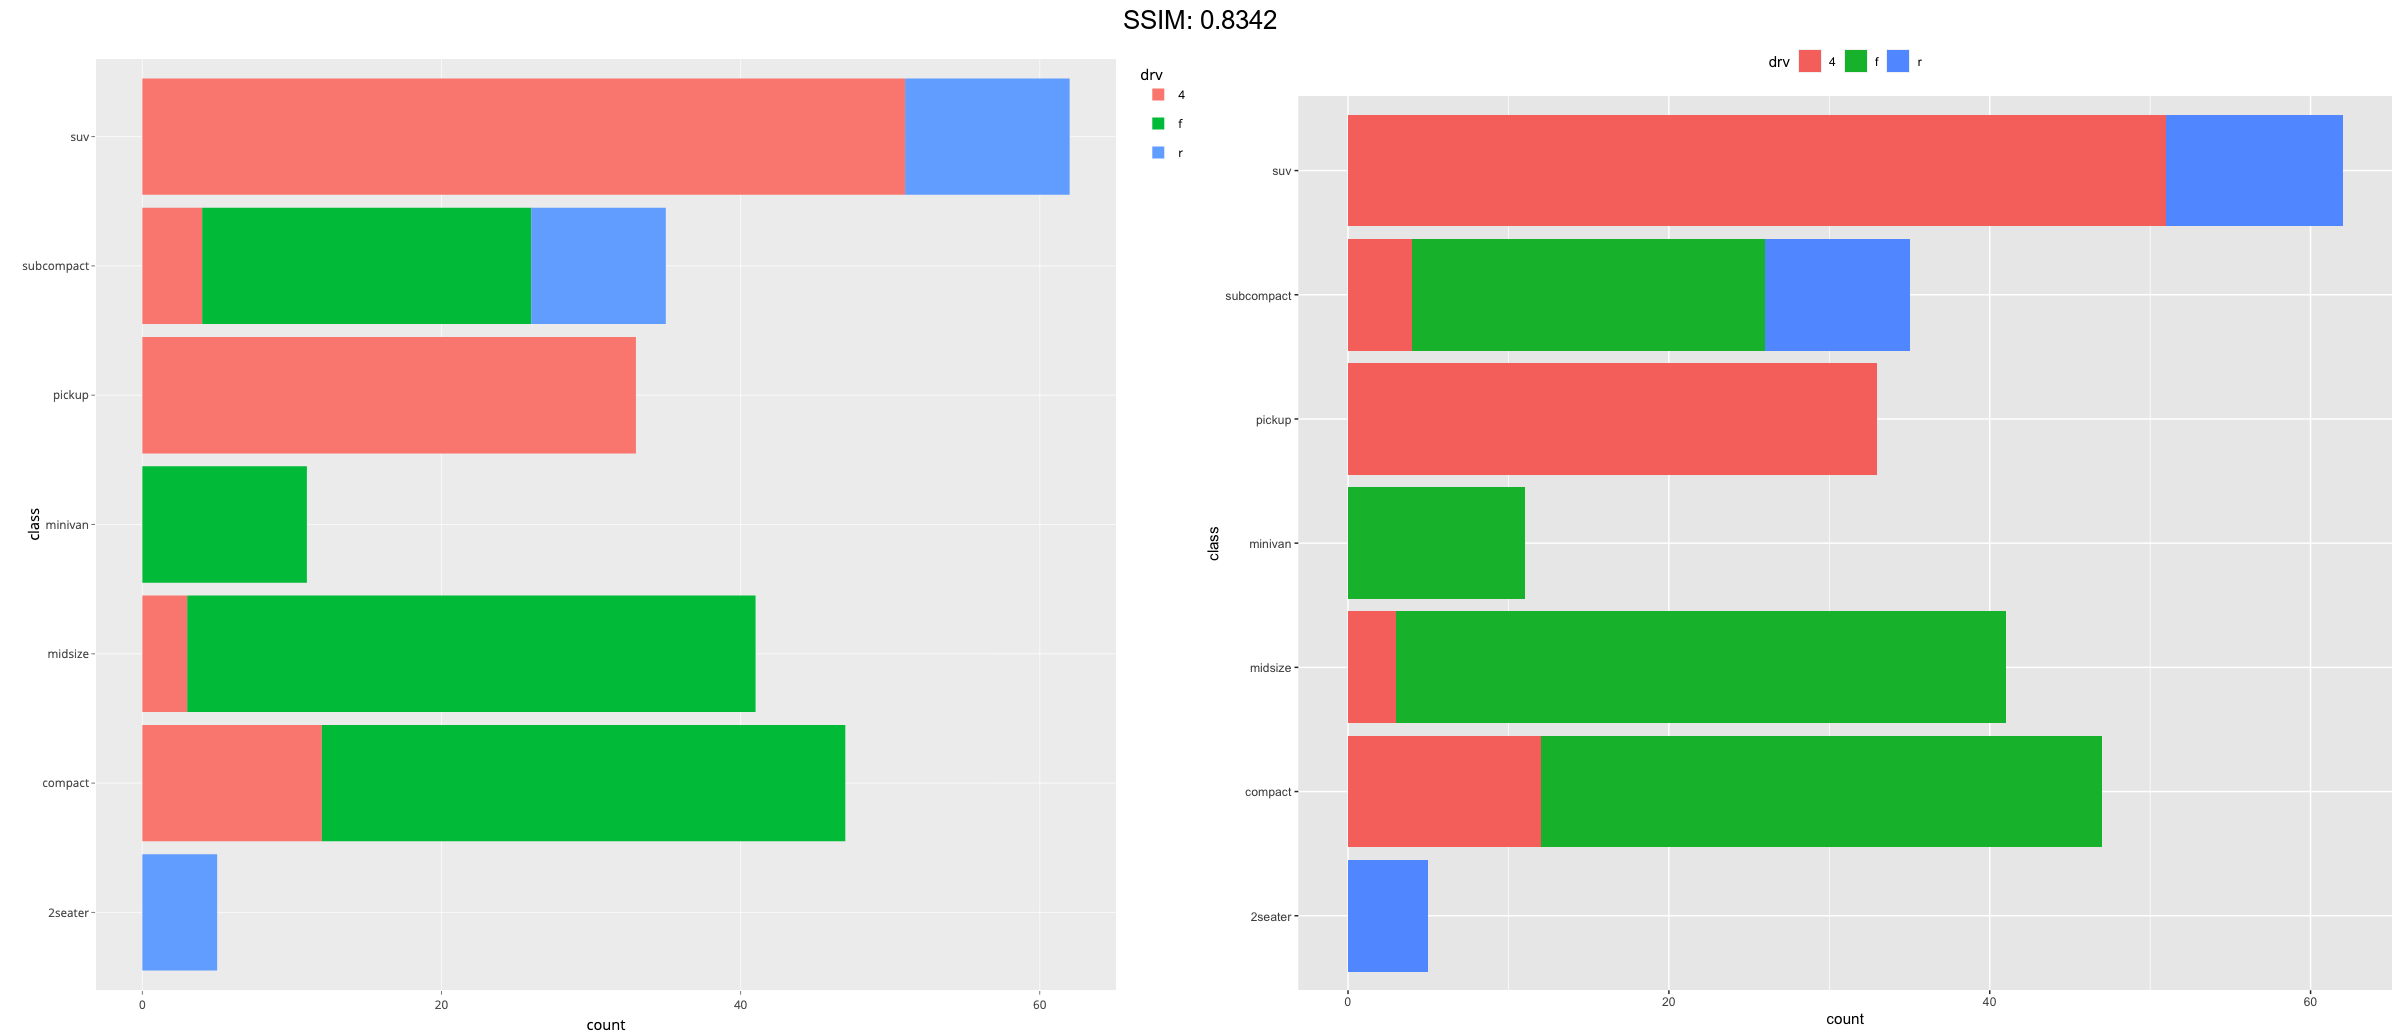
g <- ggplot(mpg, aes(class))
p <-
 ggplot(mpg, aes(y = class)) +
 geom_bar(aes(fill = drv), position = position_stack(reverse = TRUE)) +
 theme(legend.position = "top")
plotly::ggplotly(p)

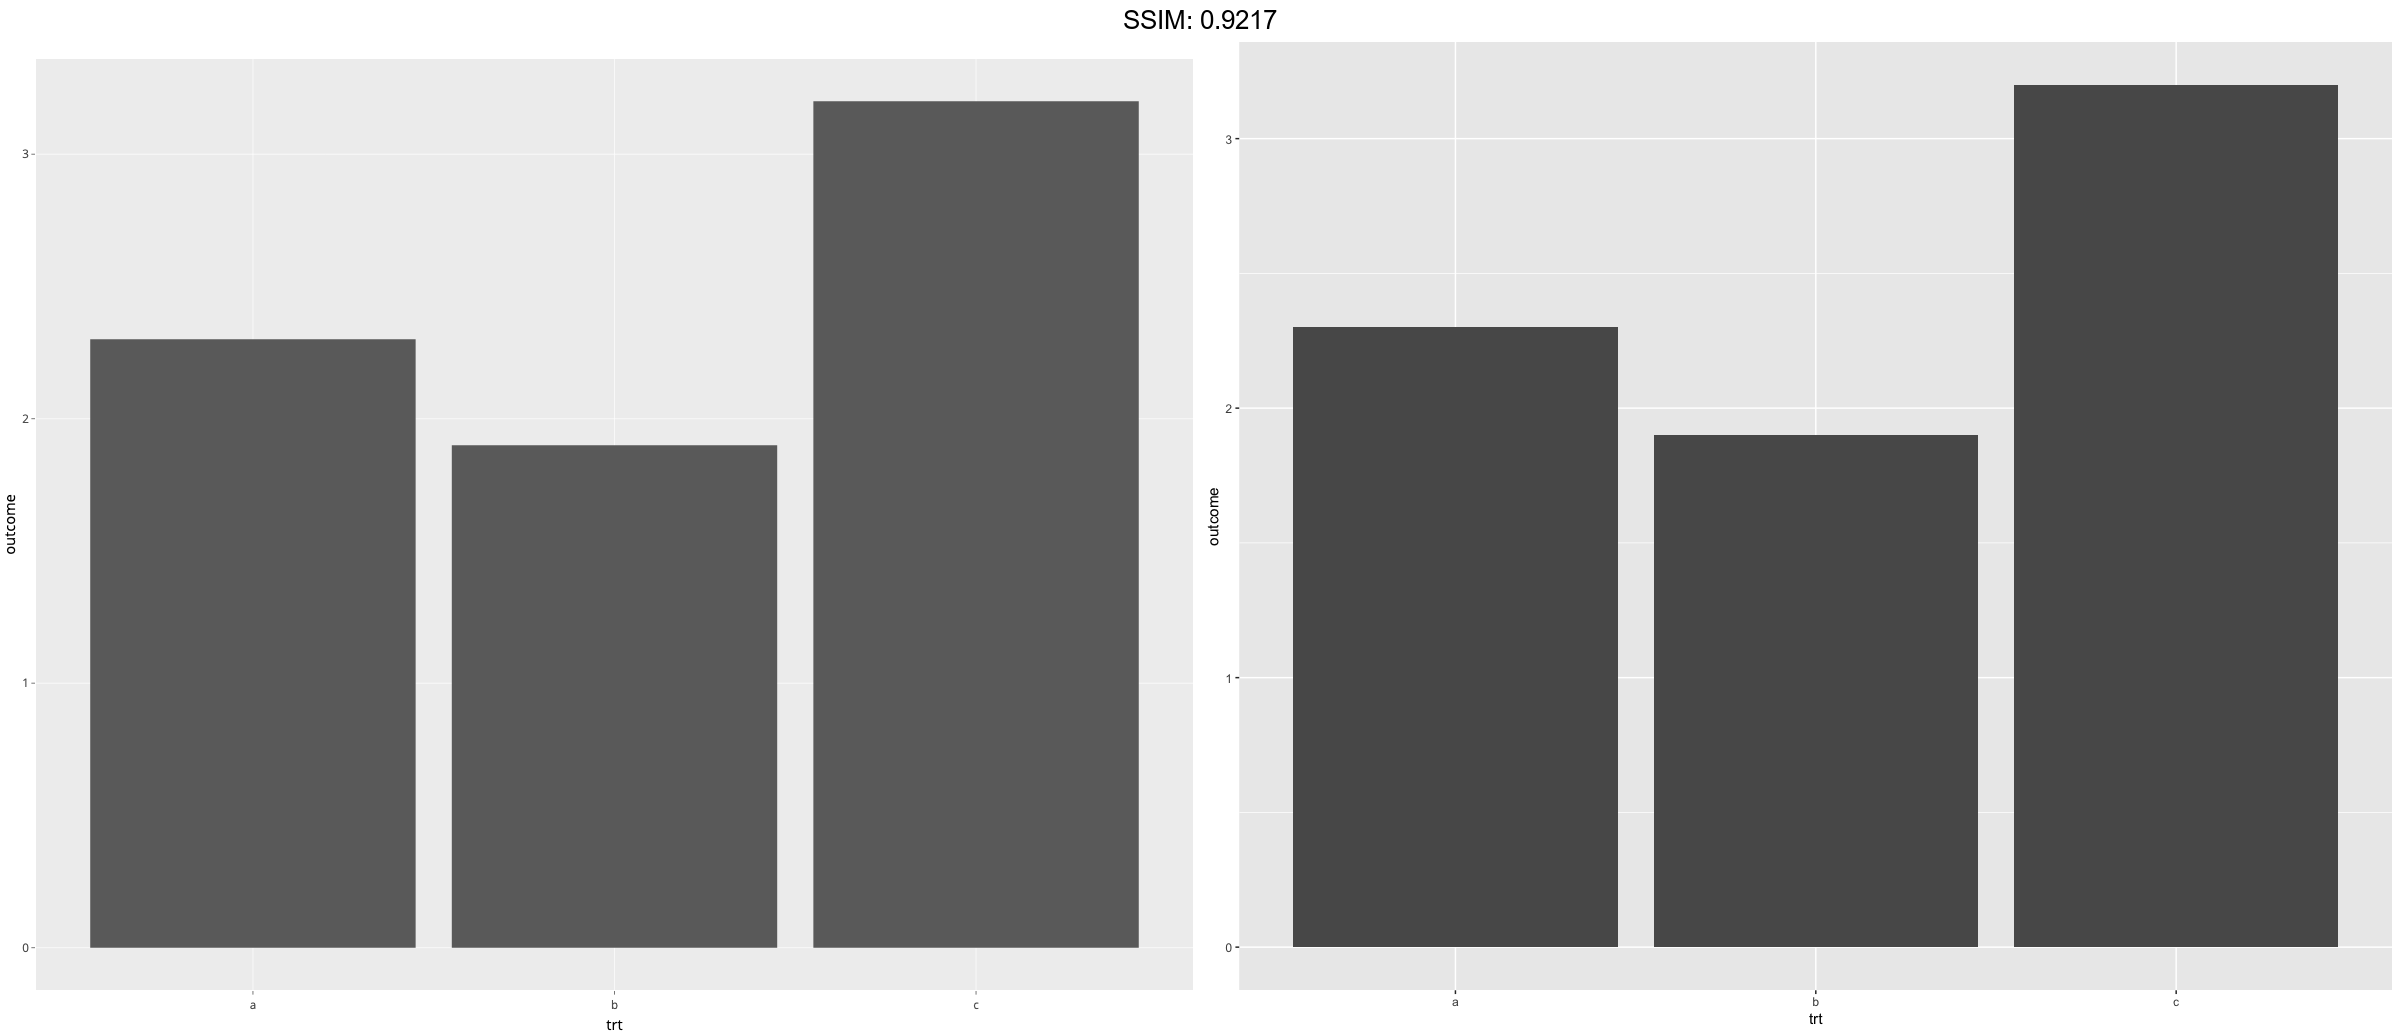
df <- data.frame(trt = c("a", "b", "c"), outcome = c(2.3, 1.9, 3.2))
p <-
 ggplot(df, aes(trt, outcome)) +
  geom_col()
plotly::ggplotly(p)

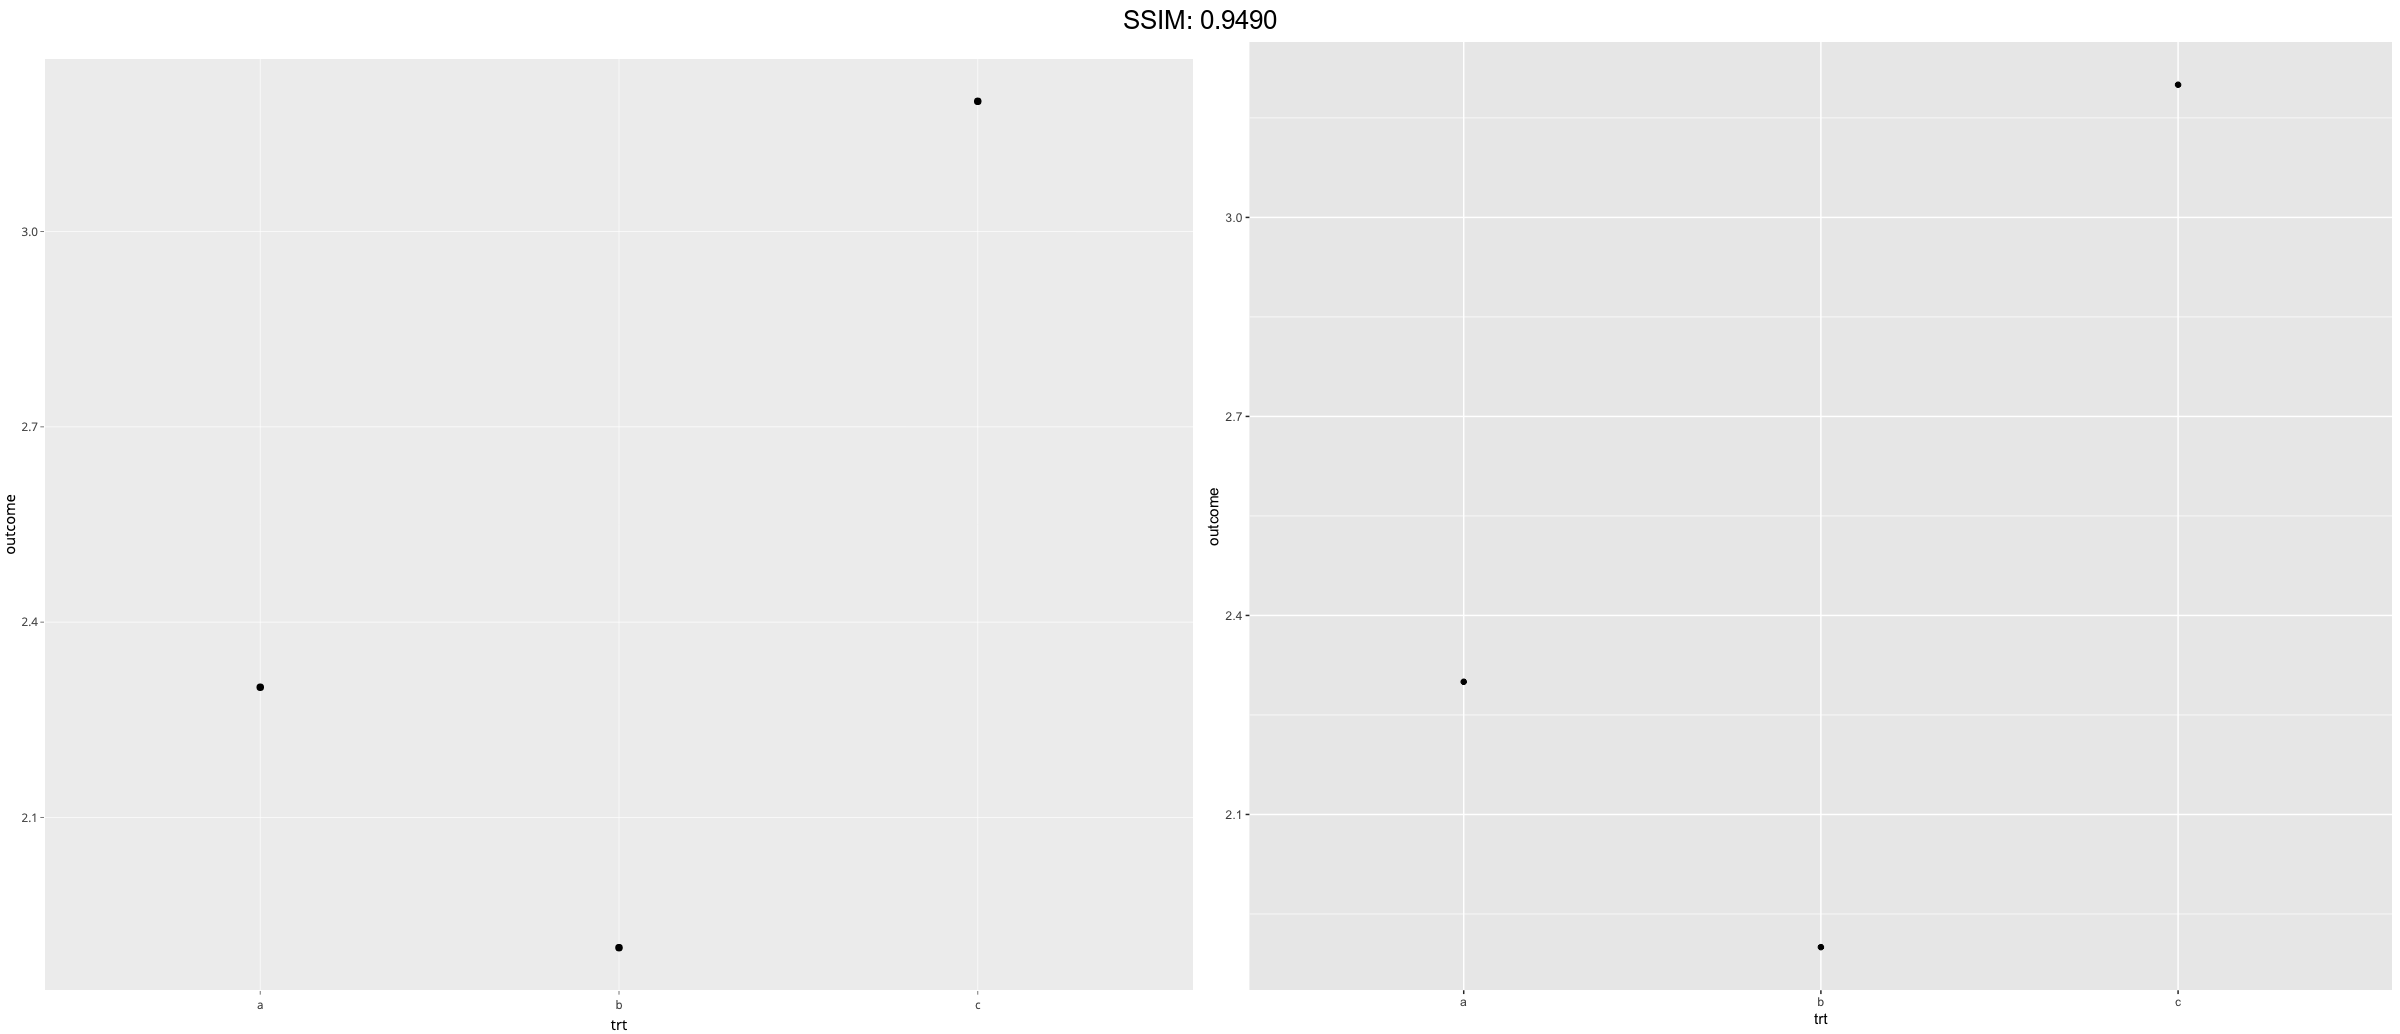
df <- data.frame(trt = c("a", "b", "c"), outcome = c(2.3, 1.9, 3.2))
p <-
 ggplot(df, aes(trt, outcome)) +
  geom_point()
plotly::ggplotly(p)
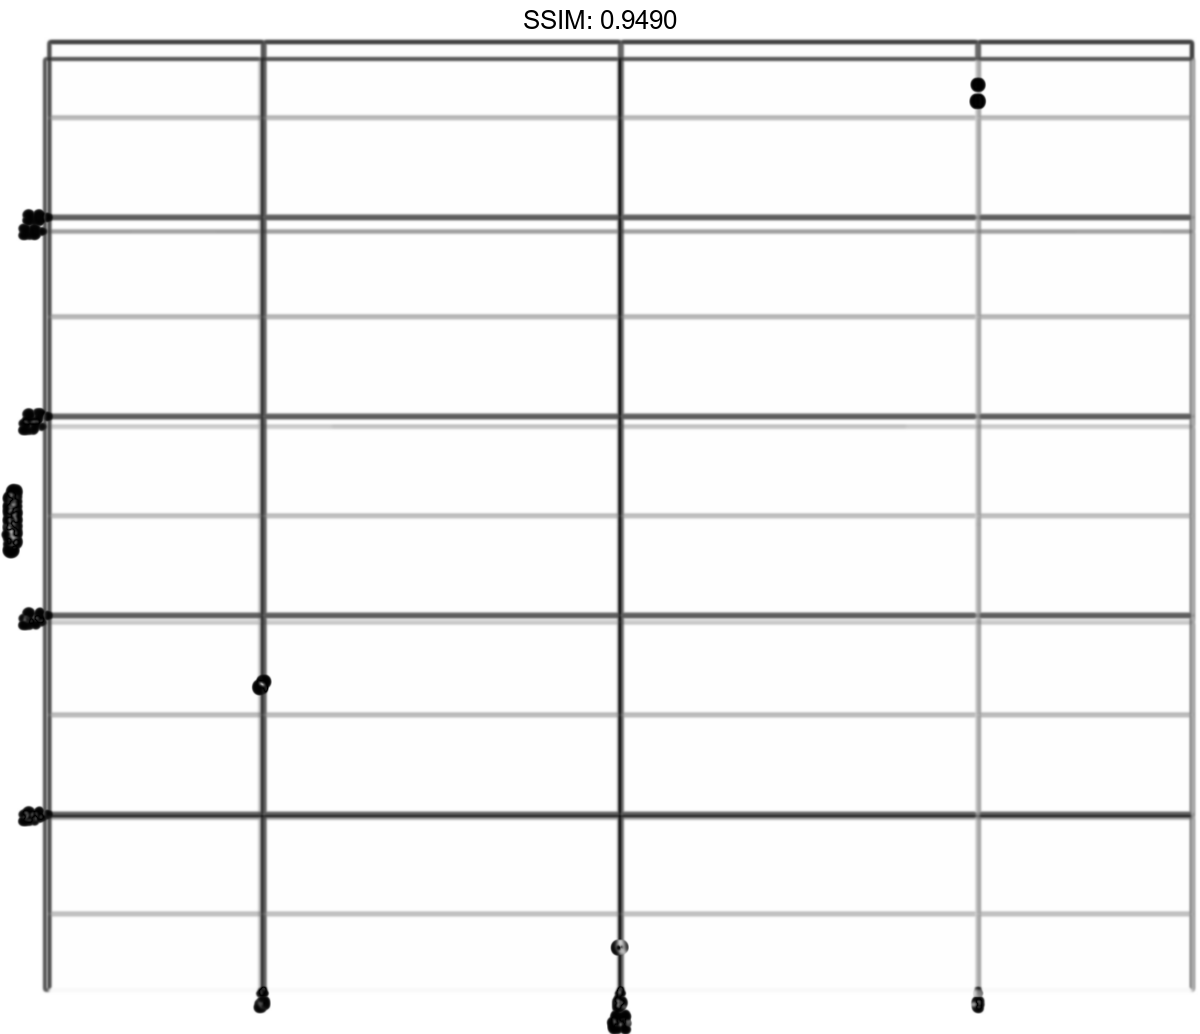
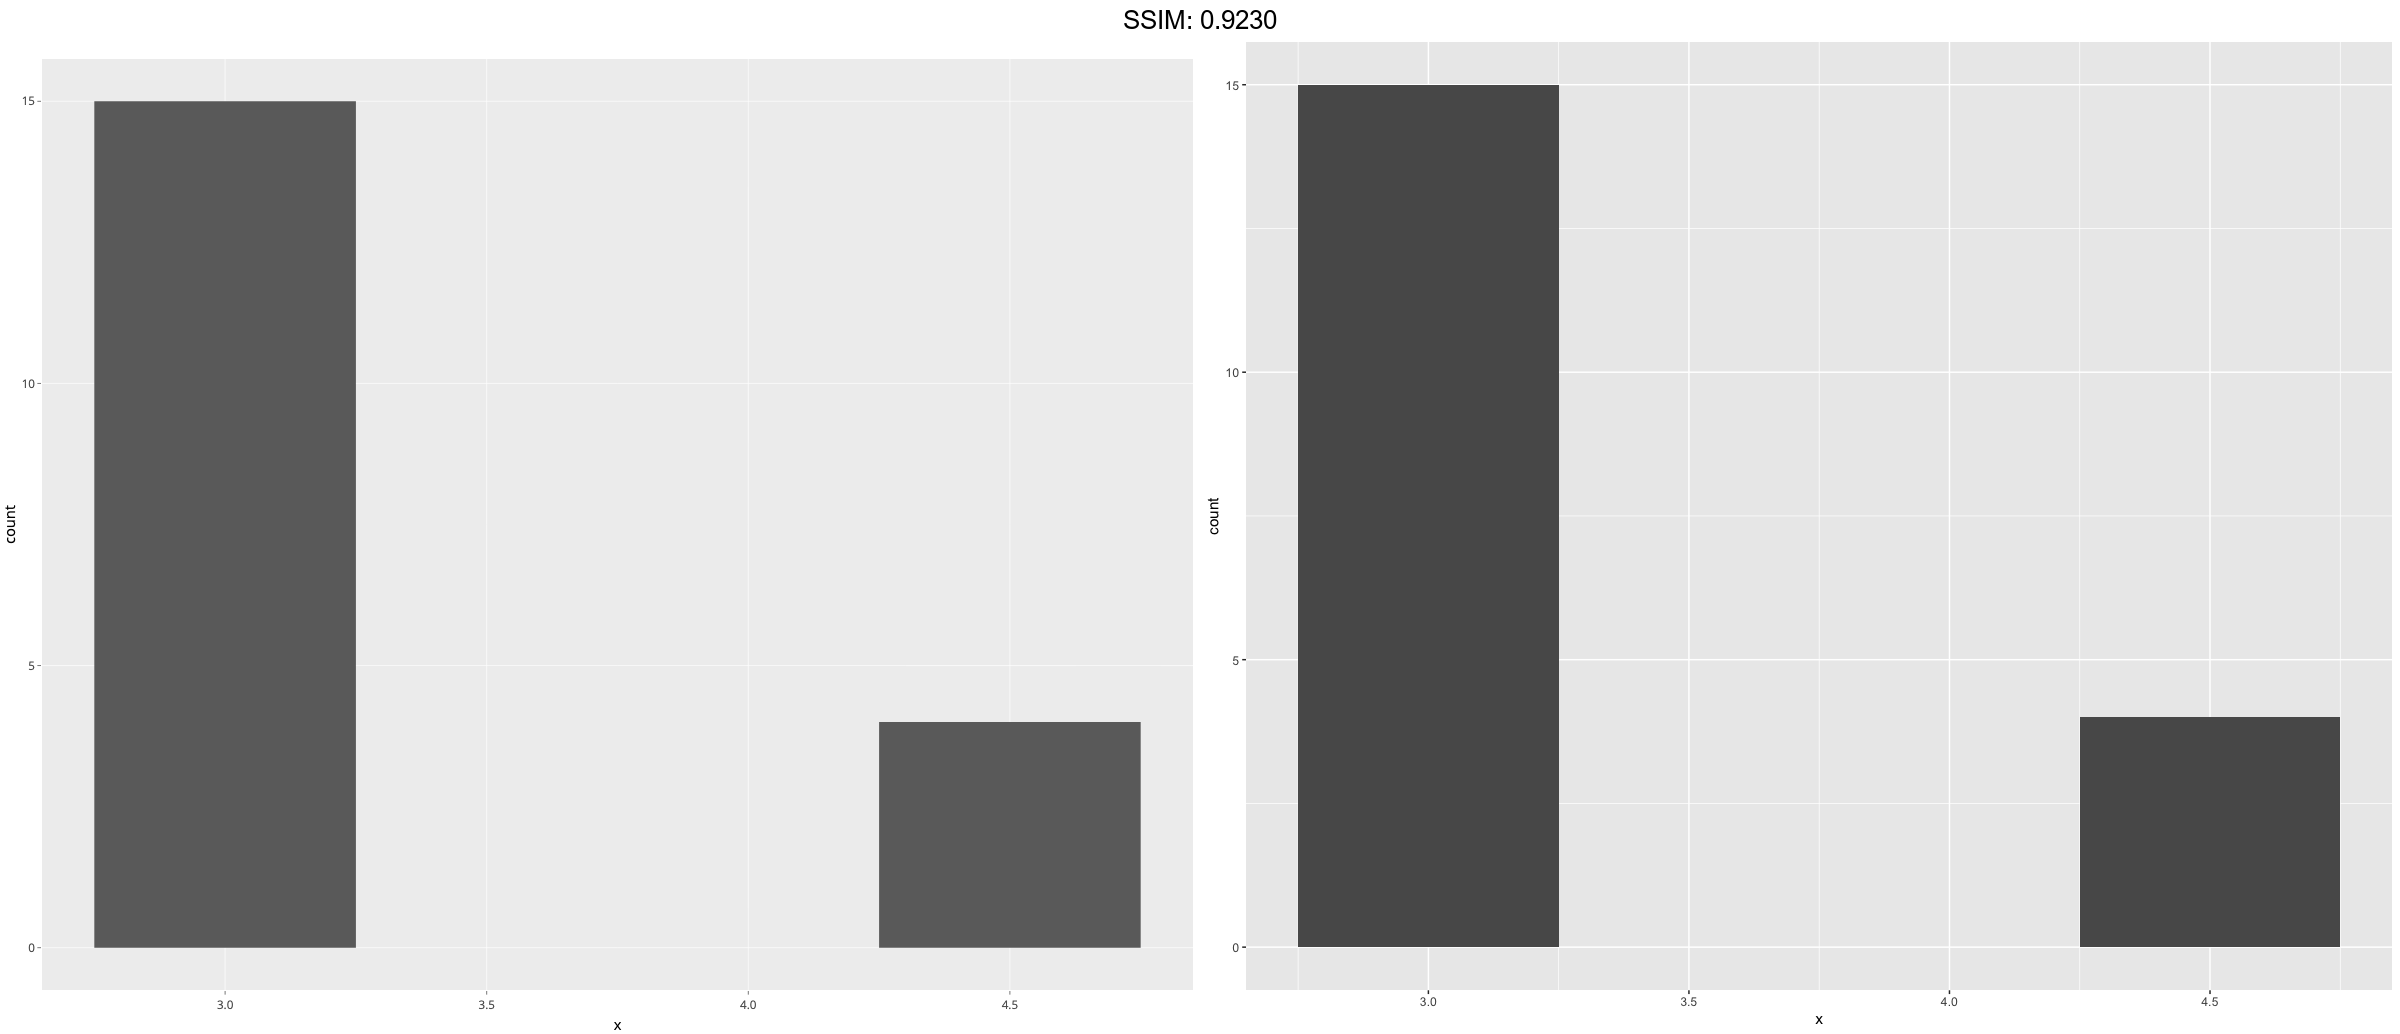
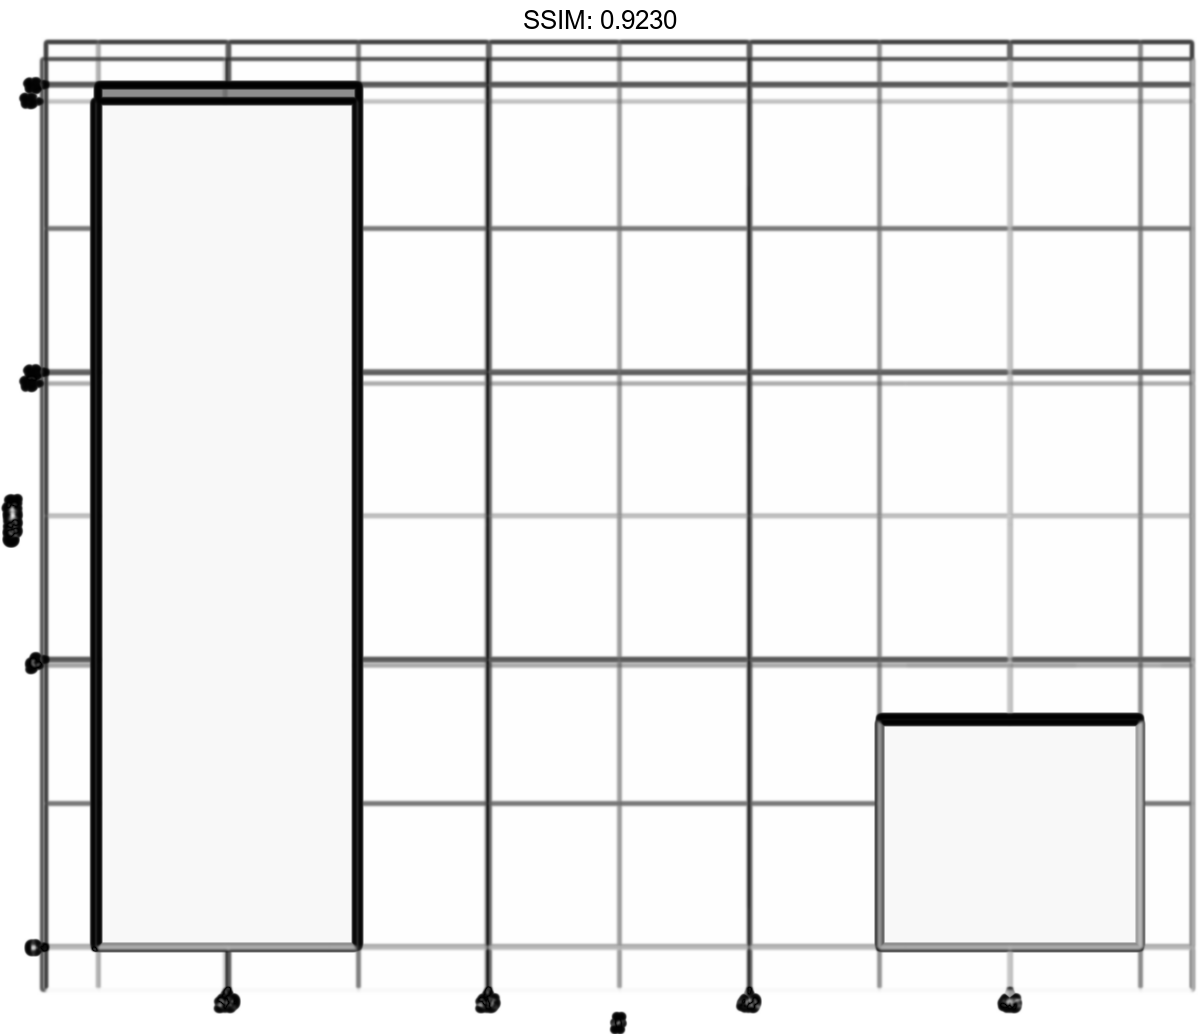
df <- data.frame(x = rep(c(2.9, 3.1, 4.5), c(5, 10, 4)))
p <-  ggplot(df, aes(x)) + geom_bar()
plotly::ggplotly(p)
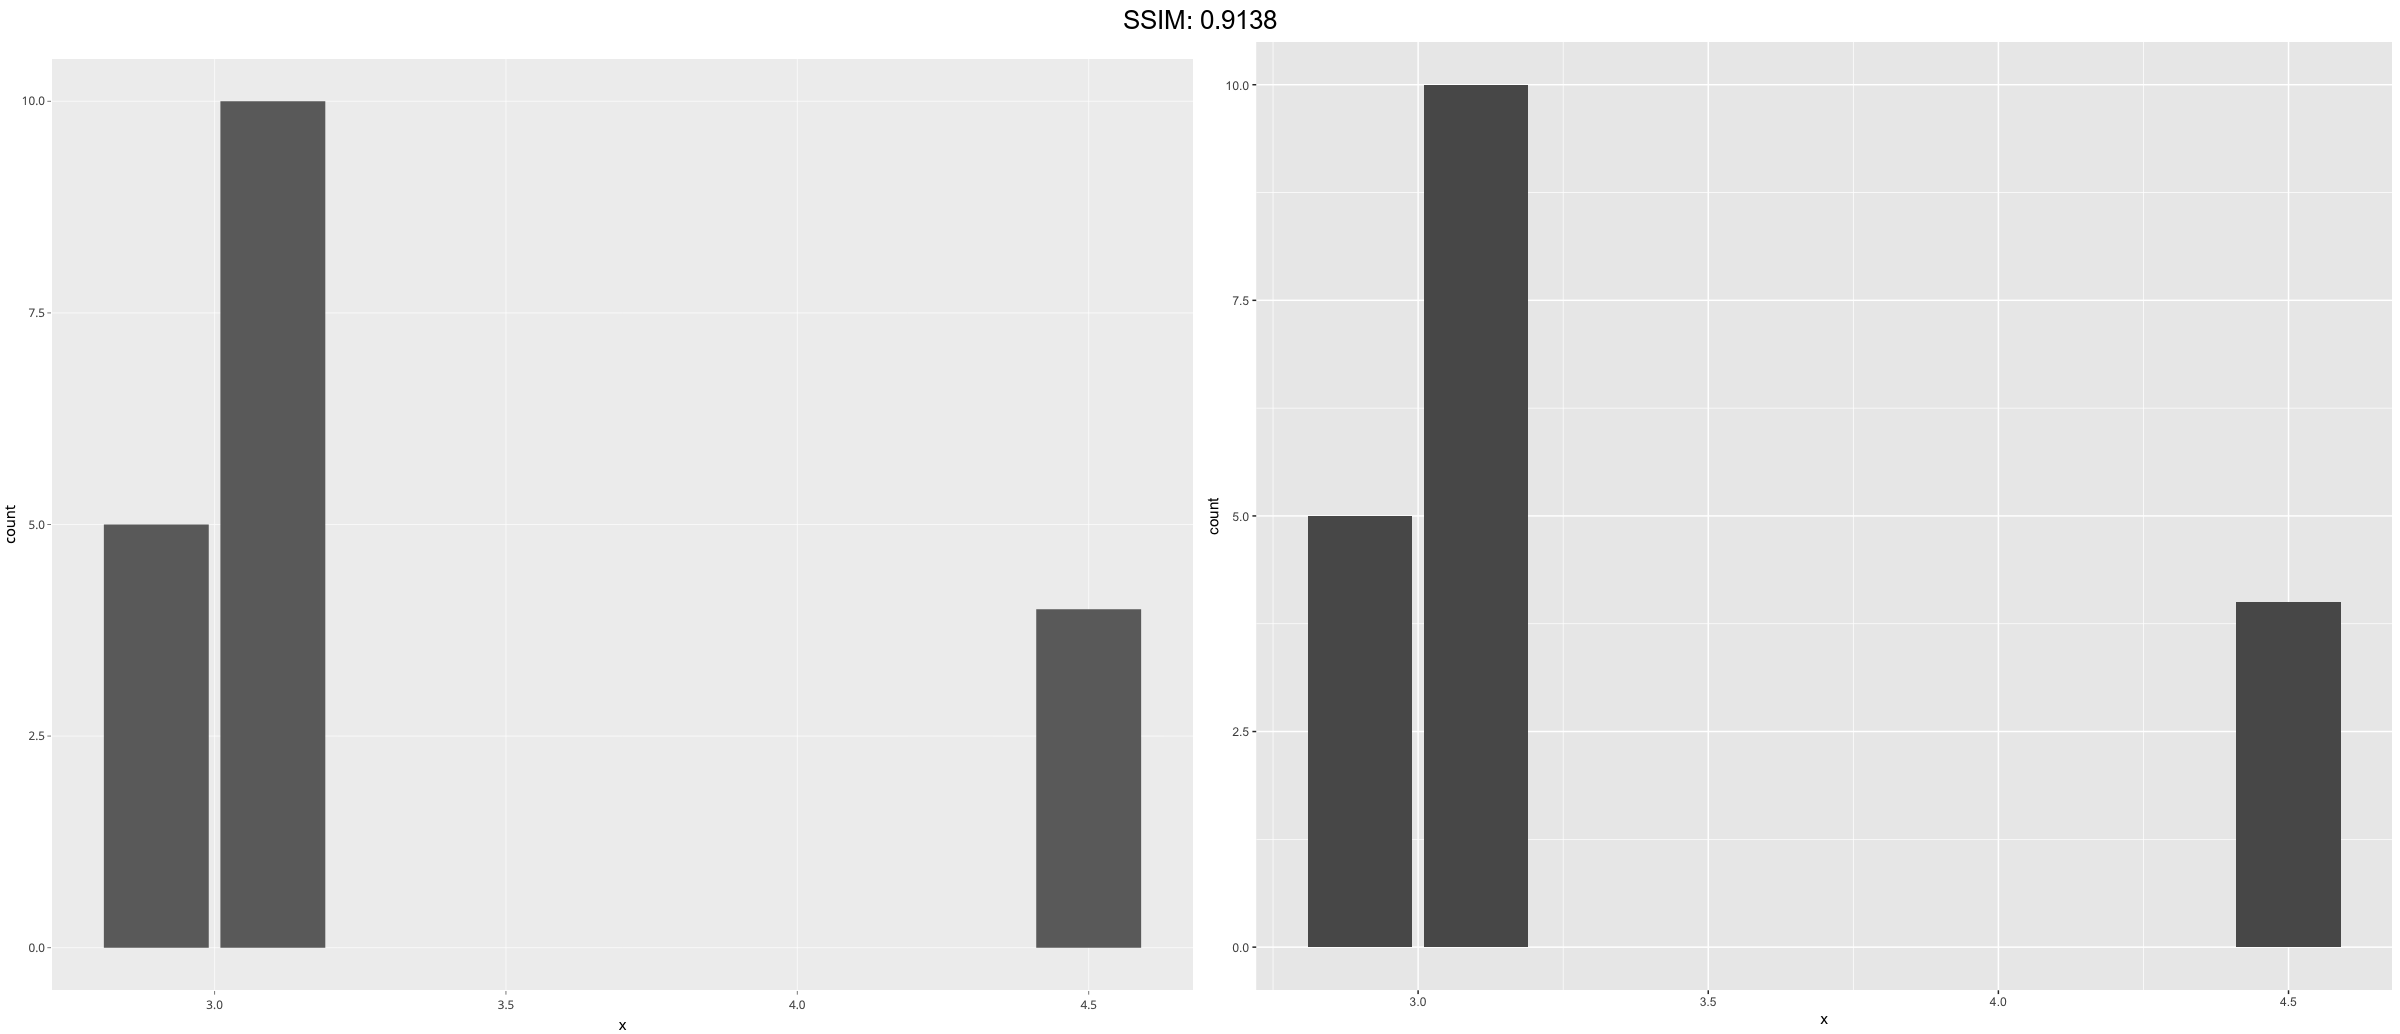
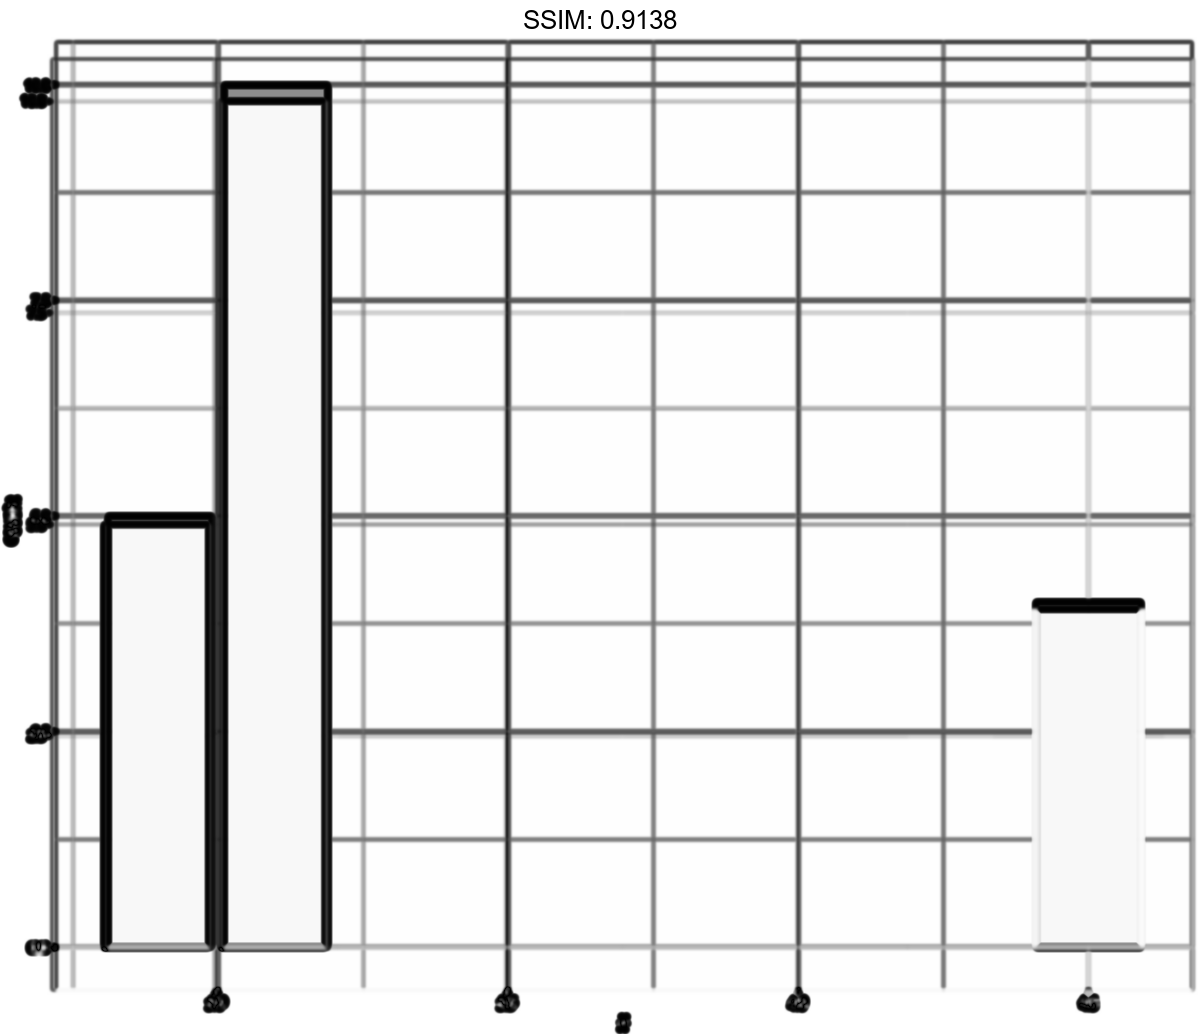
df <- data.frame(x = rep(c(2.9, 3.1, 4.5), c(5, 10, 4)))
p <-  ggplot(df, aes(x)) + geom_histogram(binwidth = 0.5)
plotly::ggplotly(p)