GGPLOT - labs
Modify axis, legend, and plot labels and then convert them with ggplotly
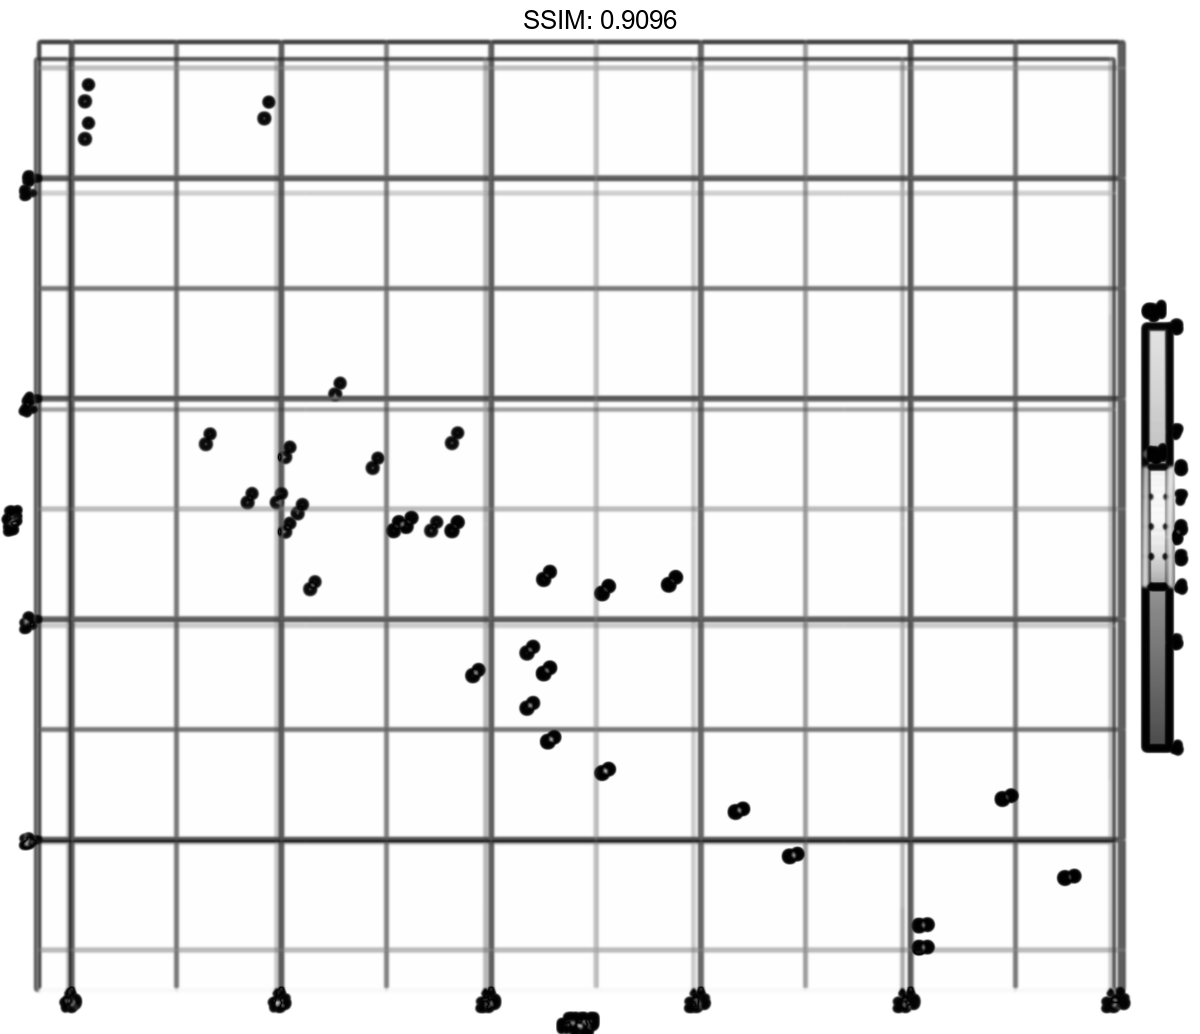
p <- ggplot(mtcars, aes(mpg, wt, colour = cyl)) + geom_point()
p <-  p + labs(colour = "Cylinders")
plotly::ggplotly(p)


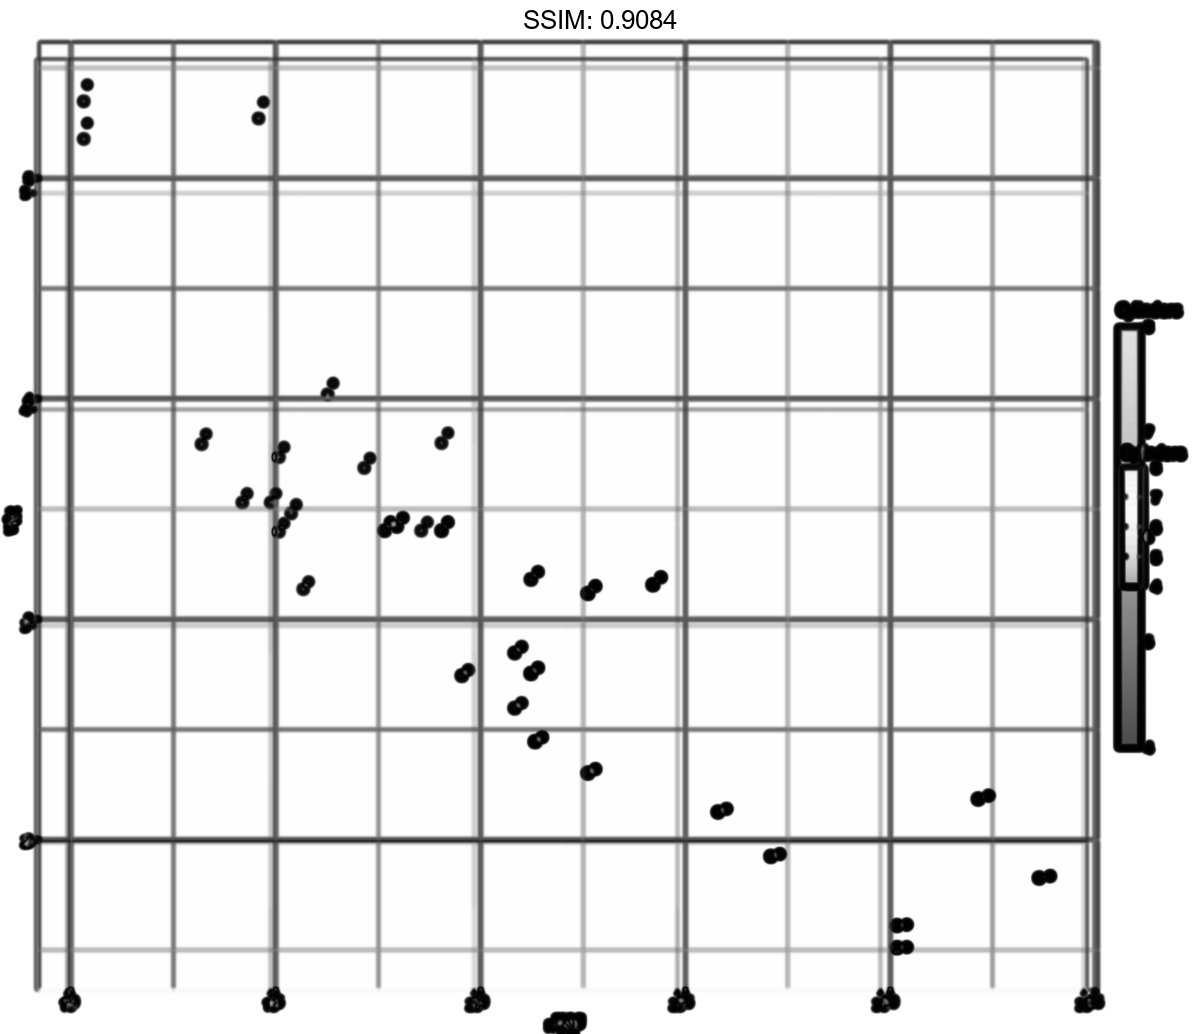
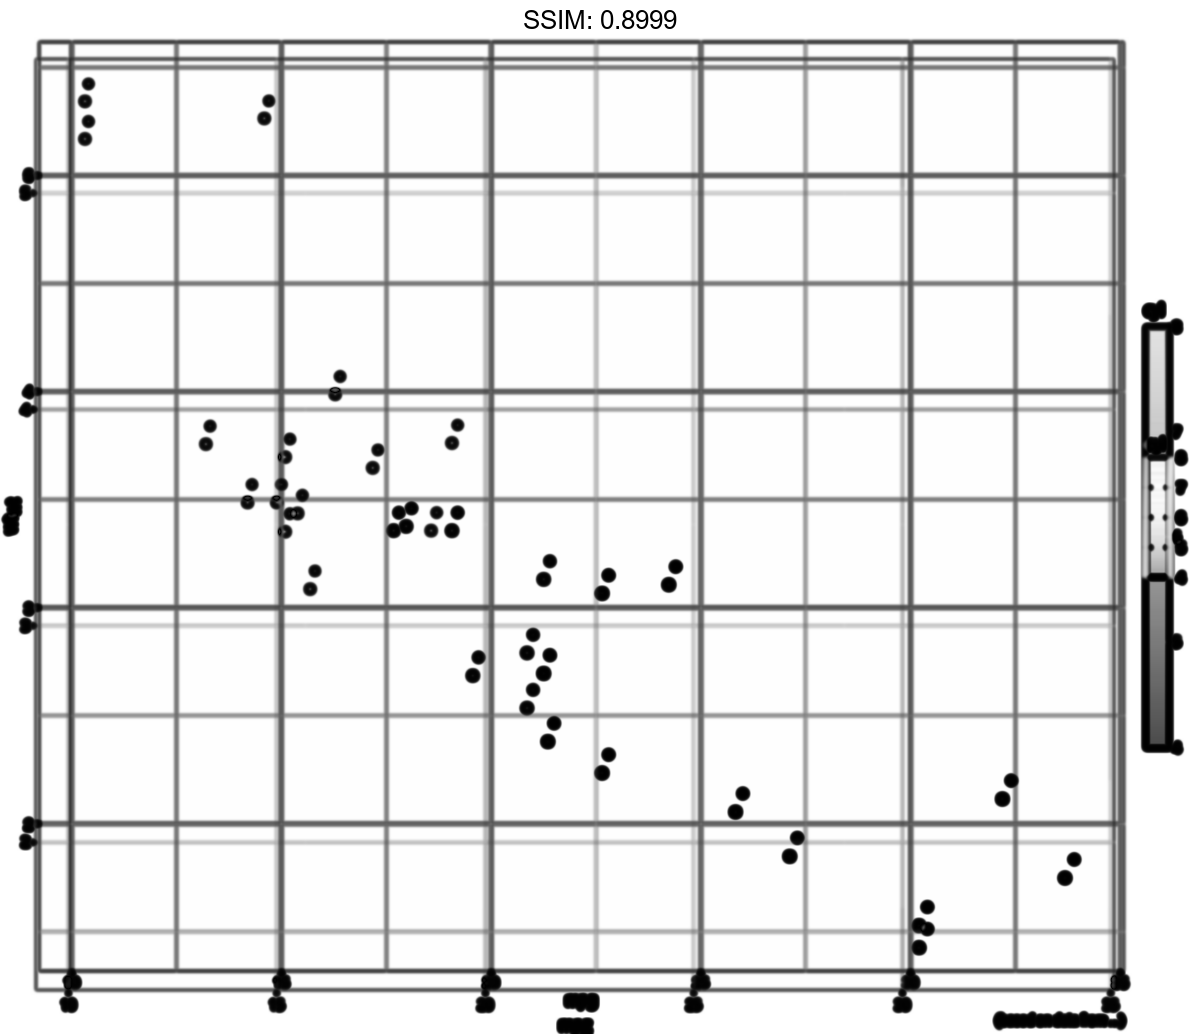
p <- ggplot(mtcars, aes(mpg, wt, colour = cyl)) + geom_point()
p <-  p + labs(x = "New x label")
plotly::ggplotly(p)

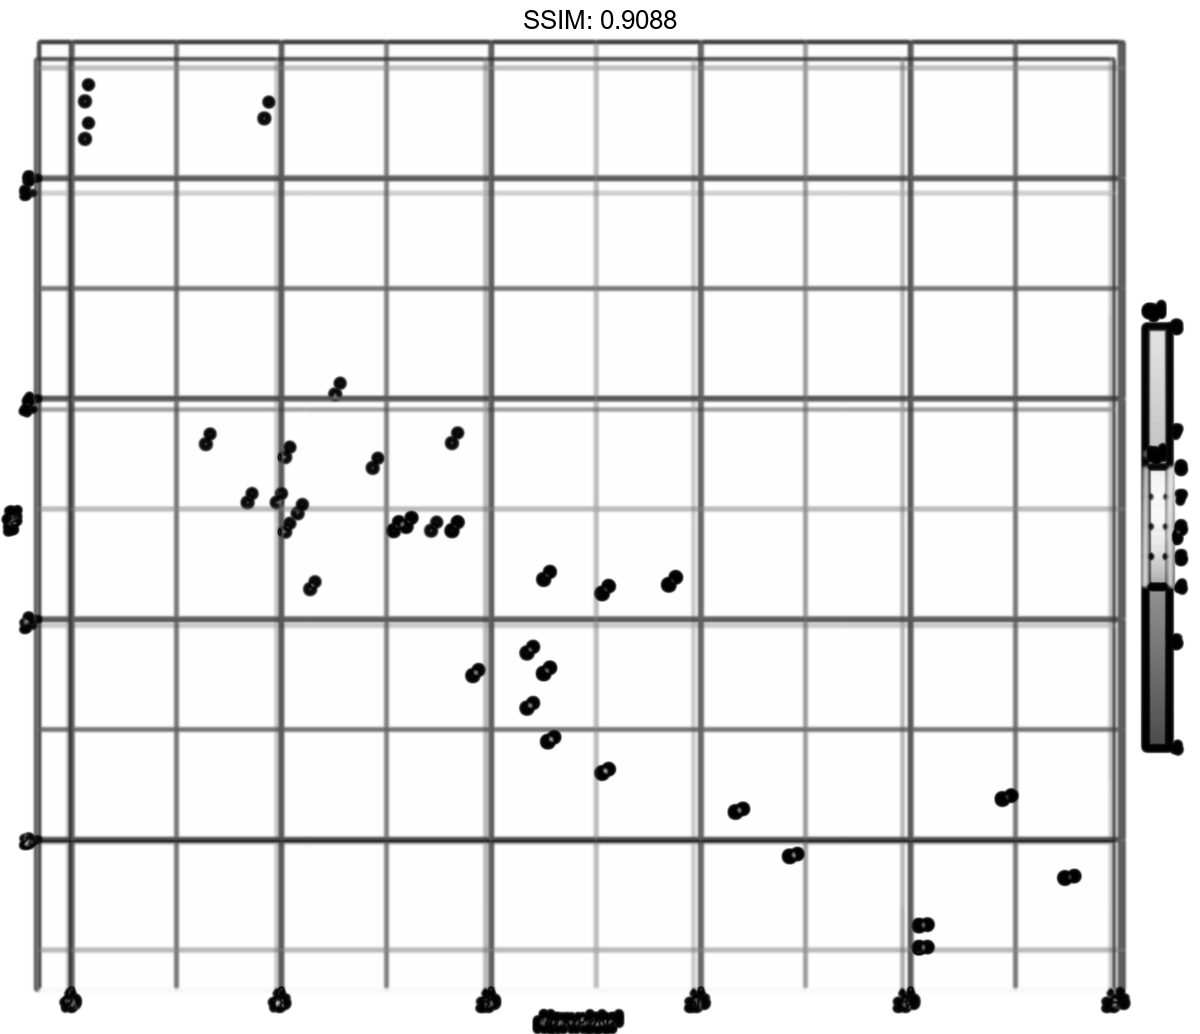
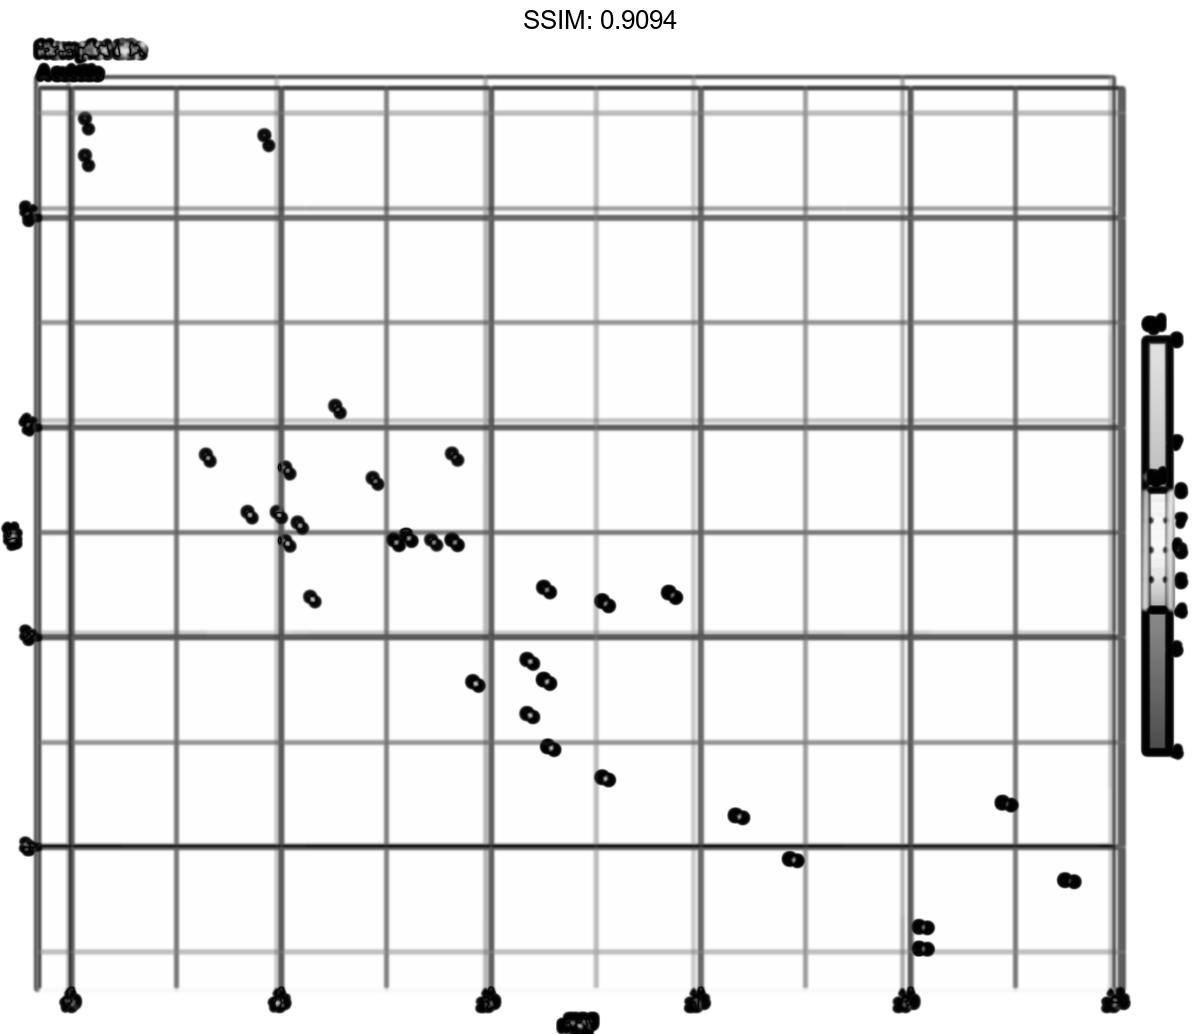
p <- ggplot(mtcars, aes(mpg, wt, colour = cyl)) + geom_point()
p <-  p + labs(title = "New plot title")
plotly::ggplotly(p)

p <- ggplot(mtcars, aes(mpg, wt, colour = cyl)) + geom_point()
p <-  p + labs(title = "New plot title", subtitle = "A subtitle")
plotly::ggplotly(p)

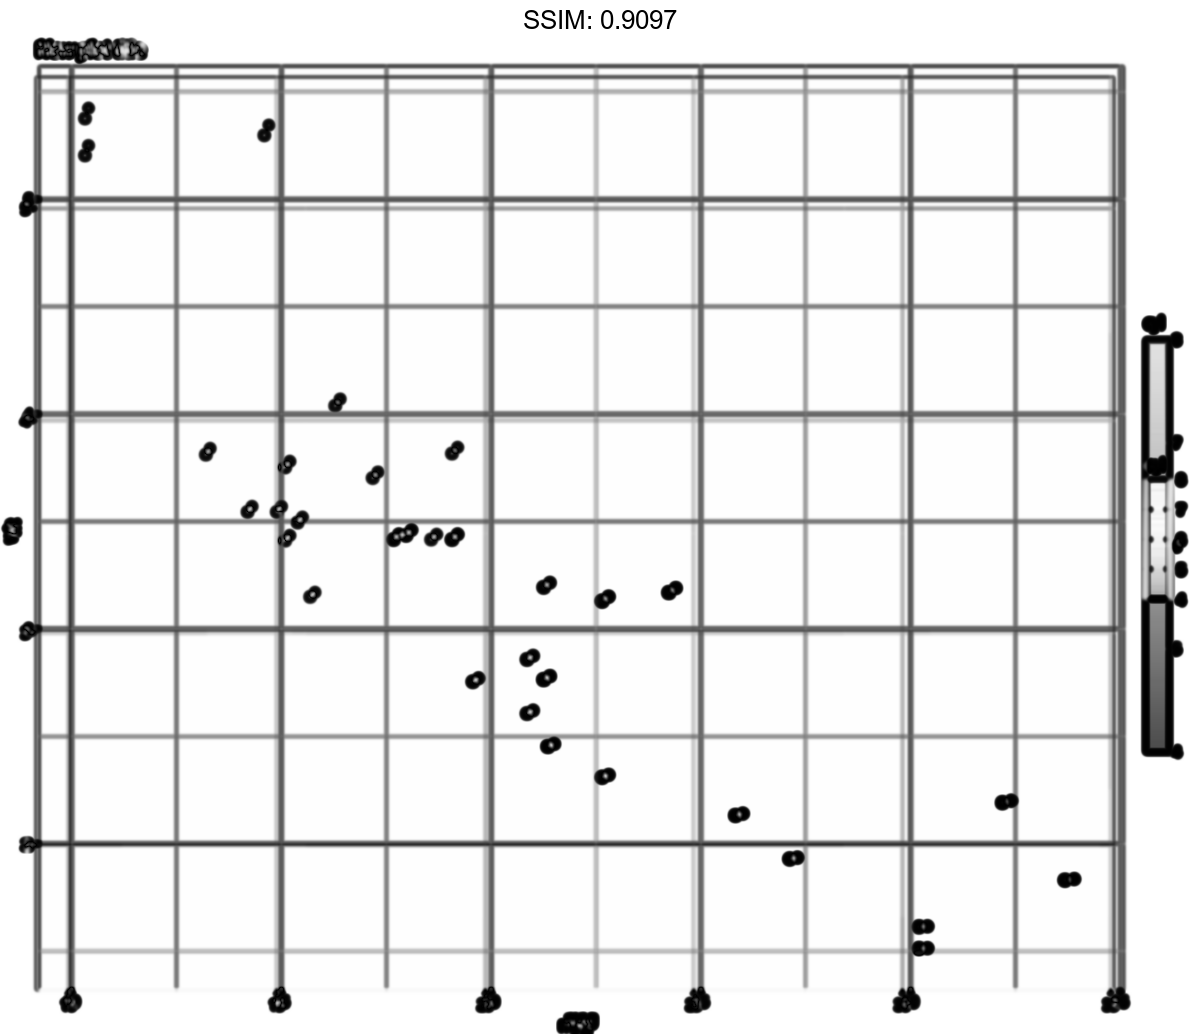
p <- ggplot(mtcars, aes(mpg, wt, colour = cyl)) + geom_point()
p <-  p + labs(caption = "(based on data from ...)")
plotly::ggplotly(p)

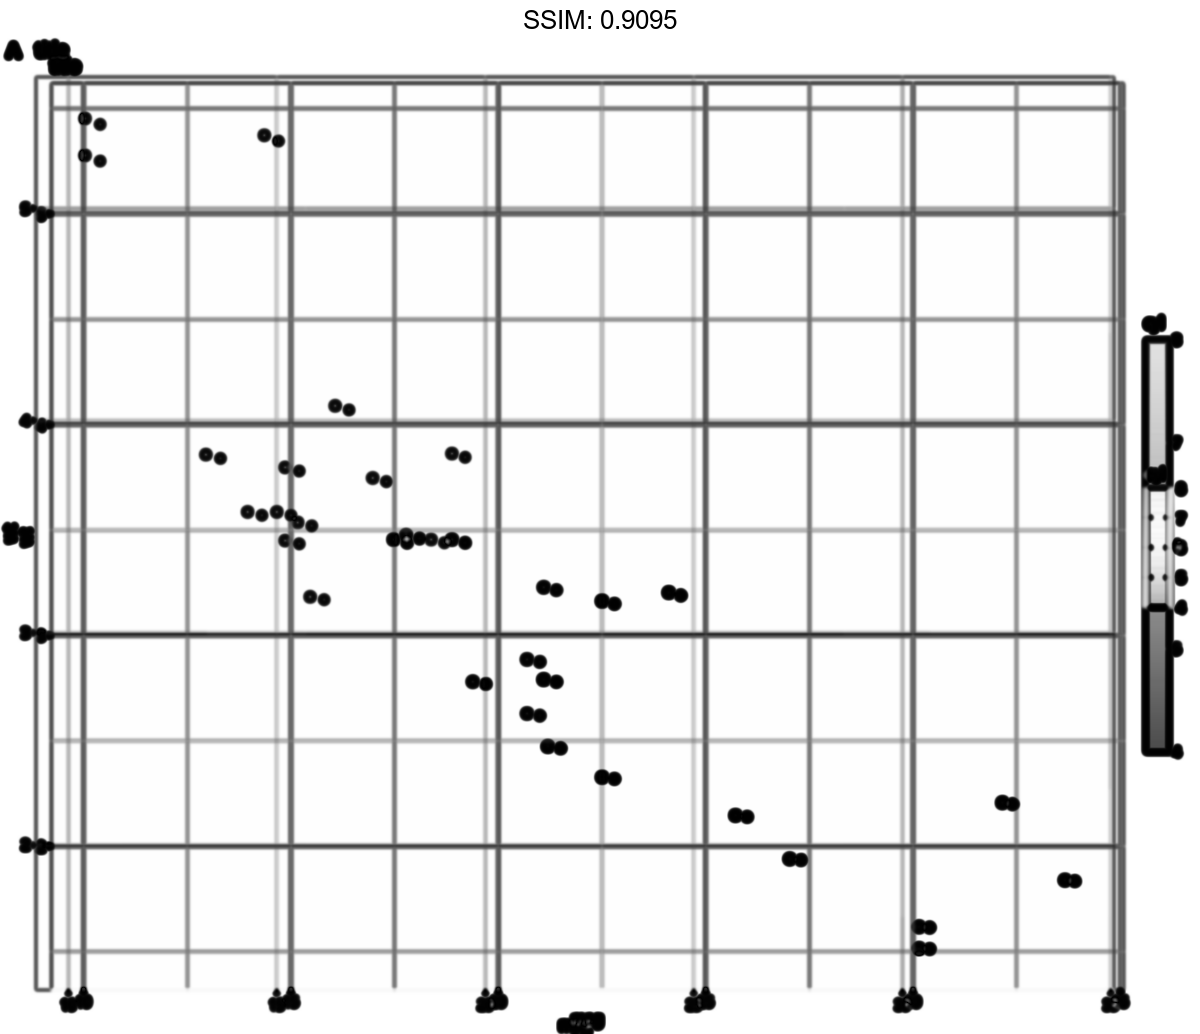
p <- ggplot(mtcars, aes(mpg, wt, colour = cyl)) + geom_point()
p <-  p + labs(title = "title", tag = "A")
plotly::ggplotly(p)

p <- ggplot(mtcars, aes(mpg, wt, colour = cyl)) + geom_point()
p <-
 p +
 labs(title = "title") +
 labs(title = NULL)
plotly::ggplotly(p)