Important Update for Chart Studio Users
Chart Studio has shut down
Chart Studio closed on October 31, 2025 at 5pm EDT. We've moved our focus to Plotly Studio and Plotly Cloud, which now serve as the home for AI-assisted visualizations and interactive data apps.
If you need to retrieve your Chart Studio data, please email support@plotly.com with the subject line "Chart Studio data request".
What's next?
Plotly Studio and Plotly Cloud offer expanded capabilities for building and sharing interactive visualizations and data applications. Both platforms provide modern workflows for teams working with data. Get started with Plotly Studio or explore Plotly Cloud.
Your data, two minutes.
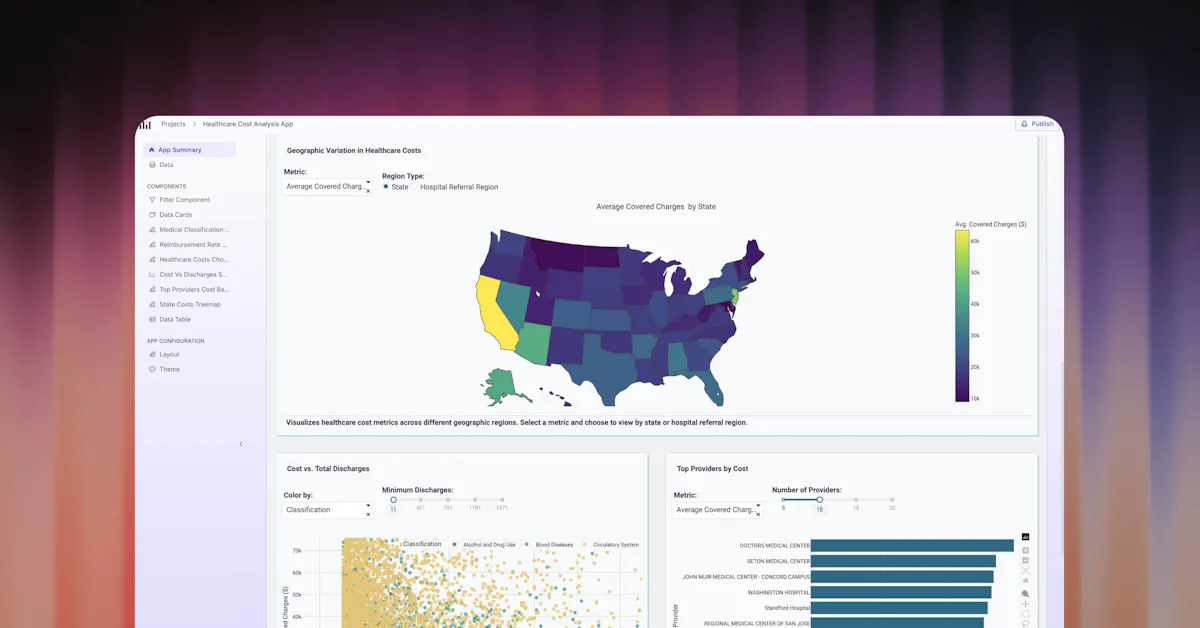
- Generate complete visual applications containing expert, production-grade Python code, multiple visualization perspectives, interactive controls, and professional architecture automatically from your dataset in minutes.
- Detect patterns and unexpected relationships across domains and variables, producing visualizations that expand how you explore your data.
- Built on ten years of Plotly expertise, with checks that catch errors and add domain knowledge, so you get reliable data apps instead of messy AI code that breaks.