Edit chart
Loading graph
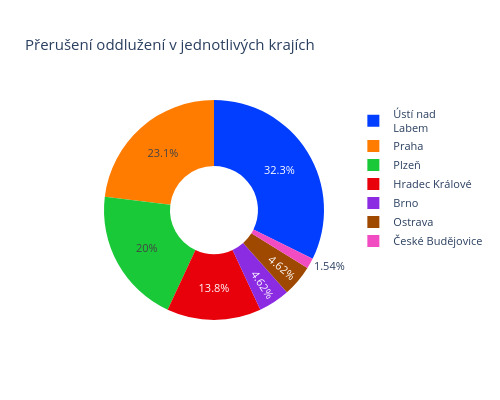
Zviri's interactive graph and data of "Přerušení oddlužení v jednotlivých krajích" is a pie; with Krajský soud in the x-axis and Počet in the y-axis.. The x-axis shows values from 0 to 0. The y-axis shows values from 0 to 0.