Edit chart
Loading graph
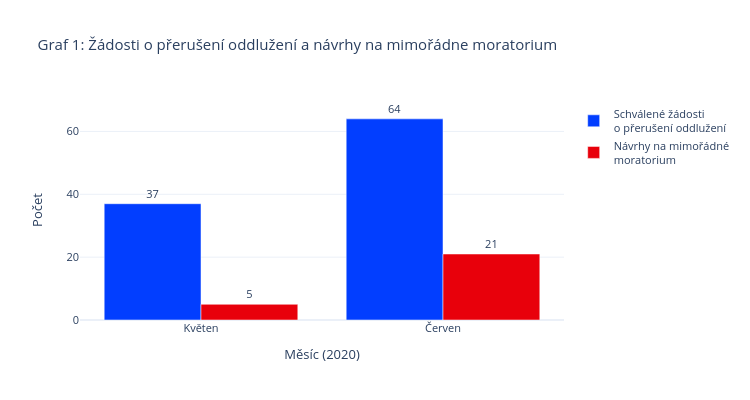
Zviri's interactive graph and data of "Graf 1: Žádosti o přerušení oddlužení a návrhy na mimořádne moratorium" is a bar chart, showing Schválené žádosti o přerušení oddlužení vs Návrhy na mimořádné moratorium; with Měsíc (2020) in the x-axis and Počet in the y-axis.. The x-axis shows values from 0 to 0. The y-axis shows values from 0 to 70.