Edit chart
Loading graph
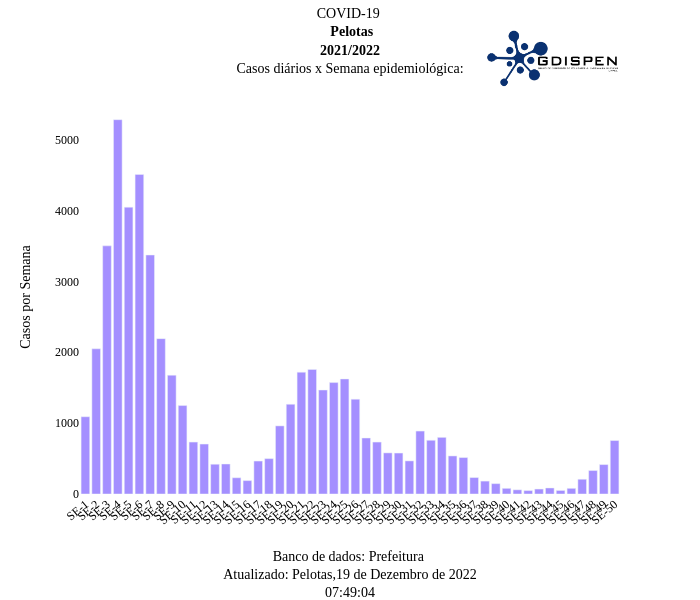
Zruk890's interactive graph and data of "COVID-19 Pelotas 2021/2022 Casos diários x Semana epidemiológica: " is a bar chart; with Banco de dados: Prefeitura Atualizado: Pelotas,19 de Dezembro de 202207:49:04 in the x-axis and Casos por Semana in the y-axis.. The x-axis shows values from 0 to 0. The y-axis shows values from 0 to 0.