Edit chart
Loading graph
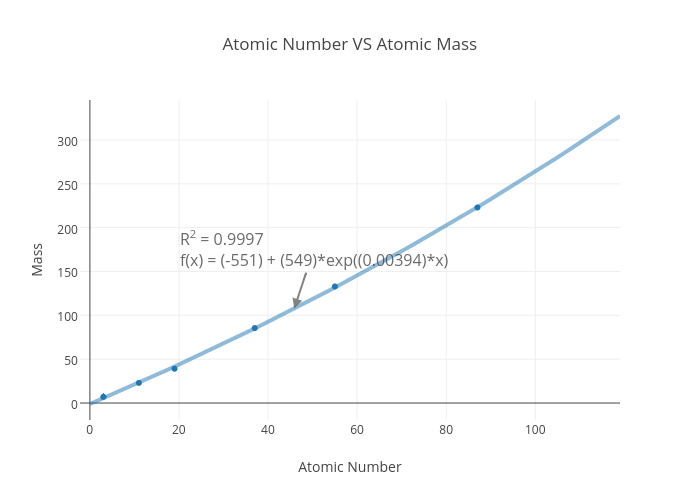
Zombieluv's interactive graph and data of "Atomic Number VS Atomic Mass" is a scatter chart, showing Mass vs Mass - fit; with Atomic Number in the x-axis and Mass in the y-axis.. The x-axis shows values from -2.2216936251189354 to 119. The y-axis shows values from -19.360098727951545 to 345.5707638969305. This visualization has the following annotation: R2 = 0.9997f(x) = (-551) + (549)*exp((0.00394)*x)