Edit chart
Loading graph
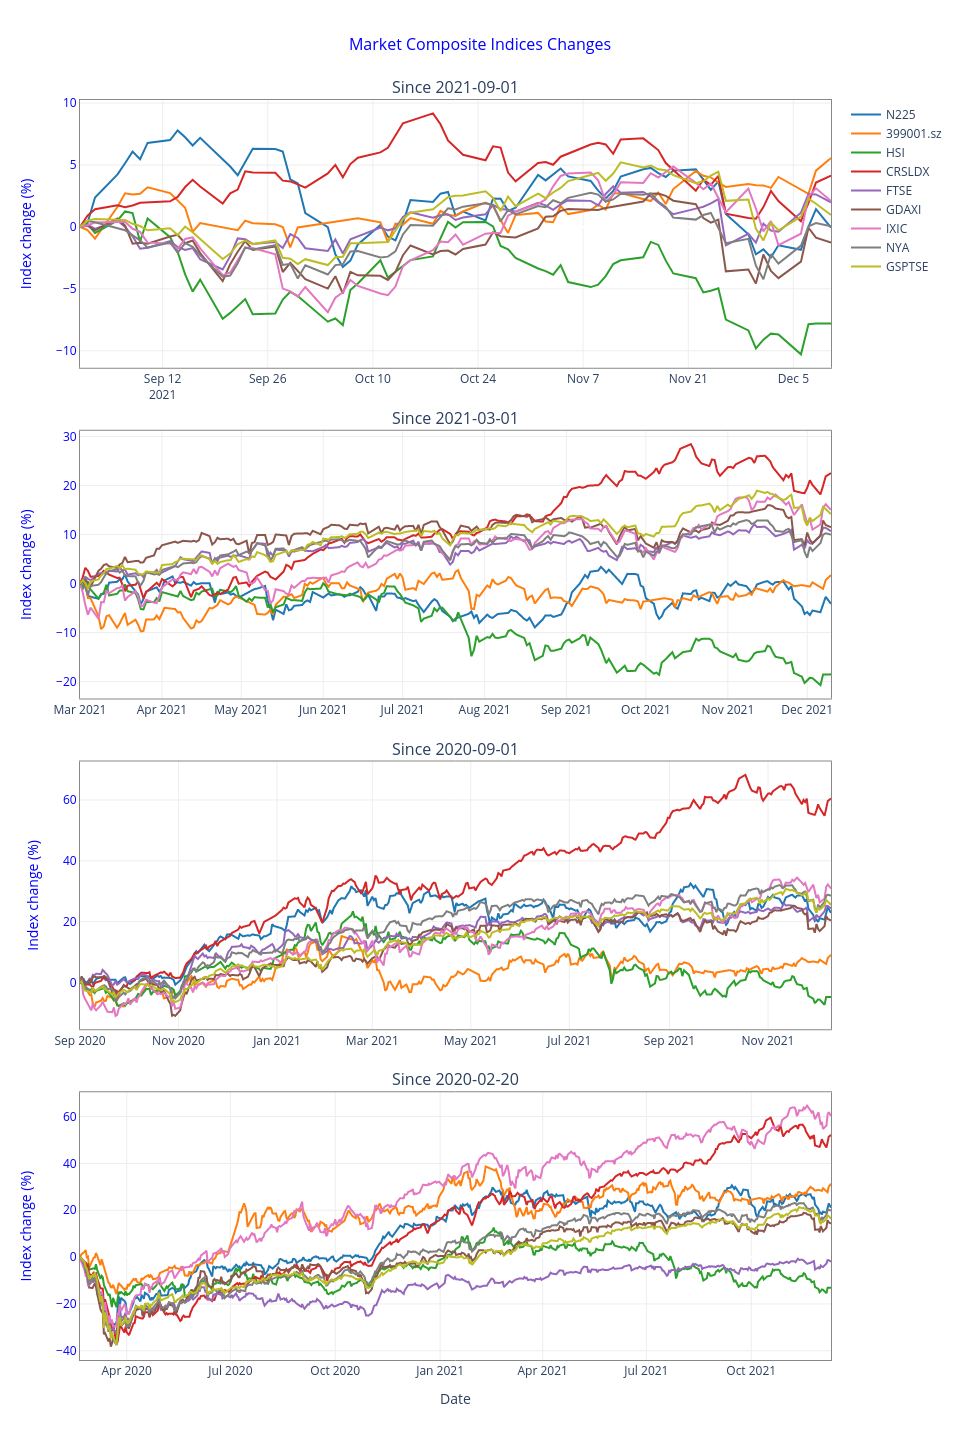
Ziwang's interactive graph and data of "Market Composite Indices Changes" is a scatter chart, showing N225, 399001.sz, HSI, CRSLDX, FTSE, GDAXI, IXIC, NYA, GSPTSE, N225, 399001.sz, HSI, CRSLDX, FTSE, GDAXI, IXIC, NYA, GSPTSE, N225, 399001.sz, HSI, CRSLDX, FTSE, GDAXI, IXIC, NYA, GSPTSE, N225, 399001.sz, HSI, CRSLDX, FTSE, GDAXI, IXIC, NYA, GSPTSE; with Index change (%) in the y-axis. The x-axis shows values from 0 to 0. The y-axis shows values from 0 to 0. This visualization has the following annotations: Since 2021-09-01; Since 2021-03-01; Since 2020-09-01; Since 2020-02-20