Edit chart
Loading graph
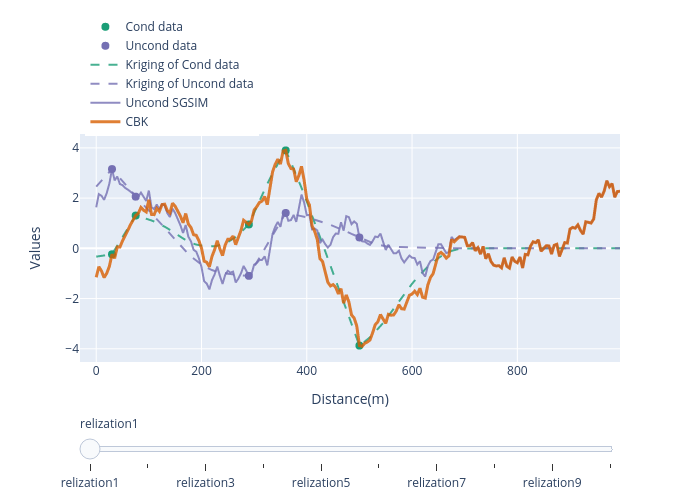
Zhadavan's interactive graph and data of "Values vs Distance(m)" is a scatter chart, showing Cond data, Uncond data, Kriging of Cond data, Kriging of Uncond data, Uncond SGSIM, CBK; with Distance(m) in the x-axis and Values in the y-axis.. The x-axis shows values from -24.92189089133884 to 995. The y-axis shows values from -4.425981792665726 to 4.453603792665726.