Edit chart
Loading graph
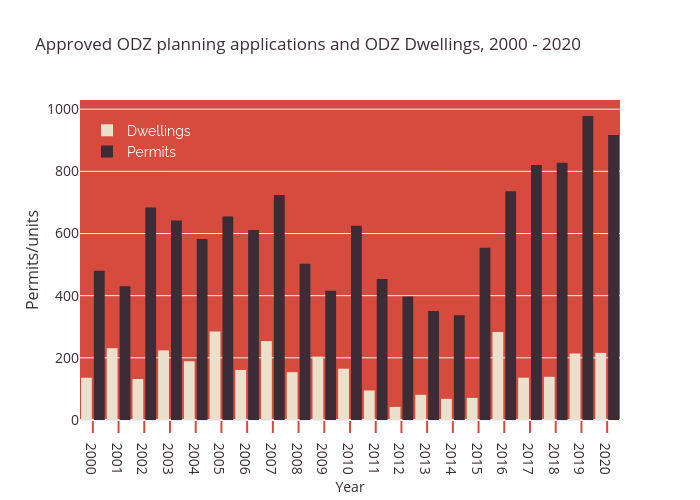
Yp41's interactive graph and data of "Approved ODZ planning applications and ODZ Dwellings, 2000 - 2020" is a grouped bar chart, showing Dwellings vs Permits; with Year in the x-axis and Permits/units in the y-axis.. The x-axis shows values from 1999.5 to 2020.5. The y-axis shows values from 0 to 1029.4736842105262.