Edit chart
Loading graph
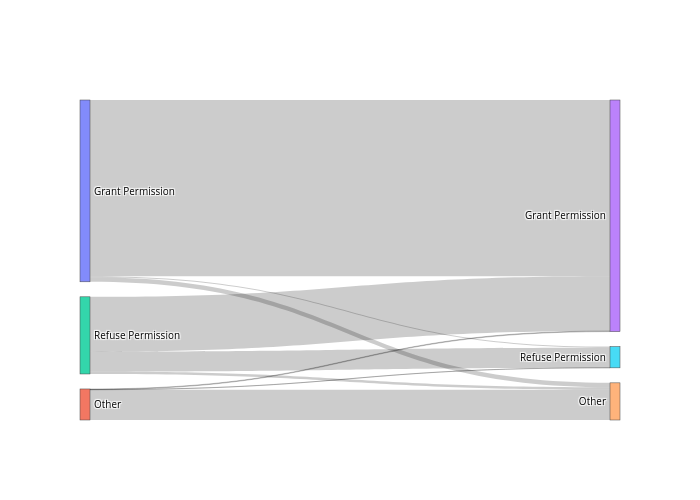
Yp41's interactive graph and data of "Decision distribution 2020" is a sankey. The x-axis shows values from 0 to 0. The y-axis shows values from 0 to 0.