Edit chart
Loading graph
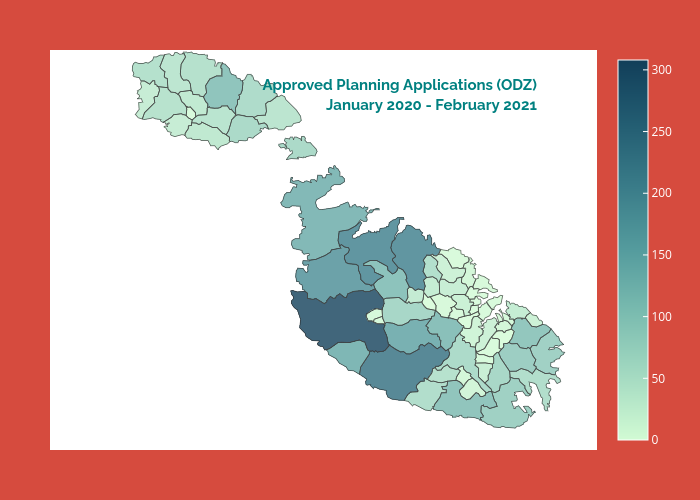
Yp41's interactive graph and data of "Approved Planning Applications (ODZ)January 2020 - February 2021" is a choroplethmapbox, showing . The x-axis shows values from 0 to 0. The y-axis shows values from 0 to 0.