Edit chart
Loading graph
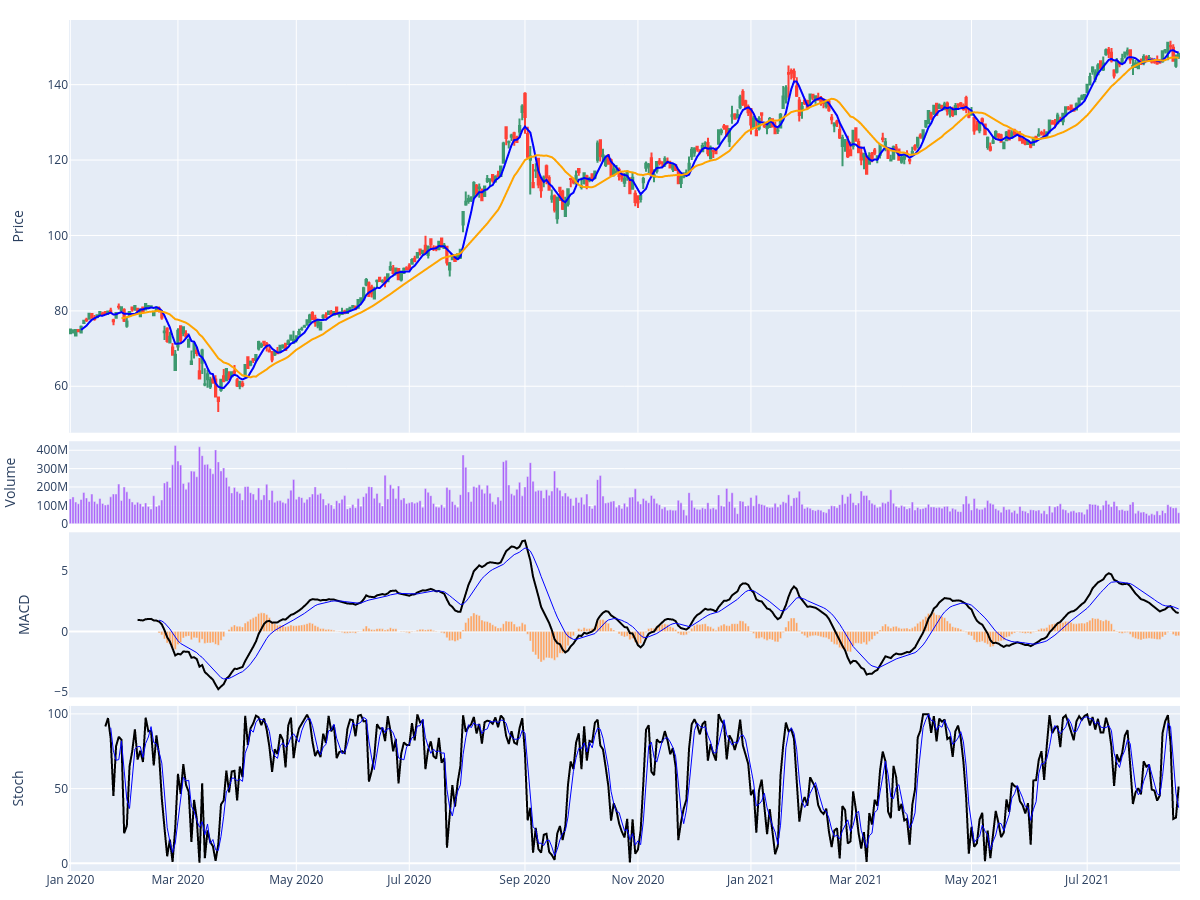
Yongghongg's interactive graph and data of "MA 5 vs MA 20" is a candlestick, showing MA 5 vs MA 20; with Price in the y-axis. The x-axis shows values from 0 to 0. The y-axis shows values from 0 to 0.