Edit chart
Loading graph
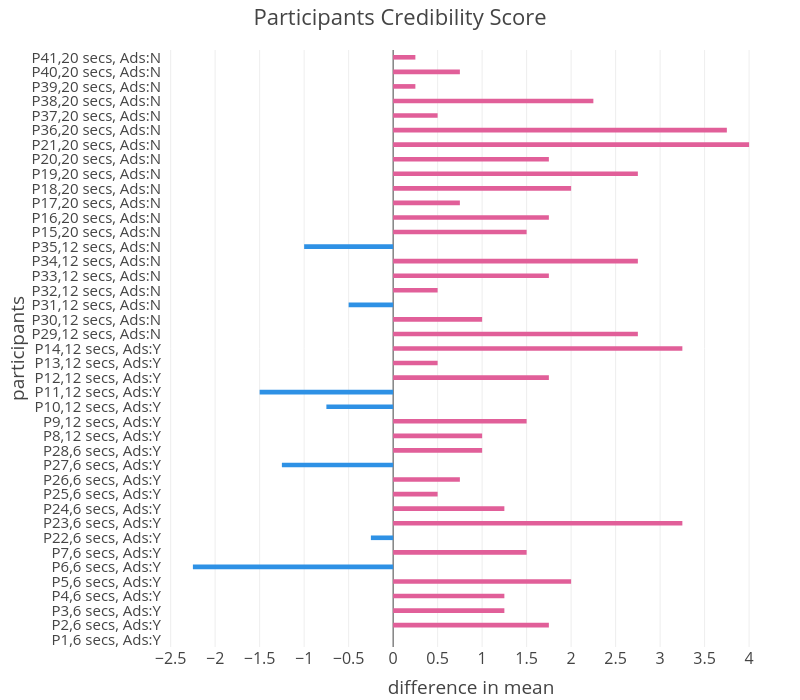
Yigezhu's interactive graph and data of "Participants Credibility Score" is a bar chart; with difference in mean in the x-axis and participants in the y-axis.. The x-axis shows values from -2.5972222222222223 to 4.347222222222222. The y-axis shows values from -0.5 to 40.5.