Edit chart
Loading graph
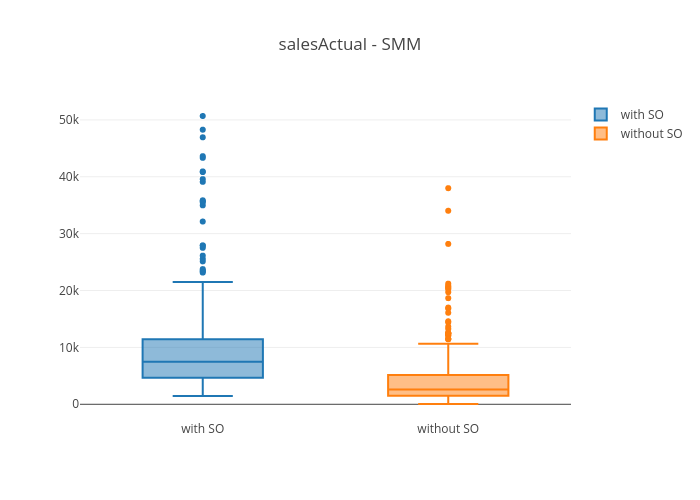
Yang.z.8's interactive graph and data of "salesActual - SMM" is a box plot, showing with SO vs without SO. The x-axis shows values from 0 to 0. The y-axis shows values from 0 to 0.