Edit chart
Loading graph
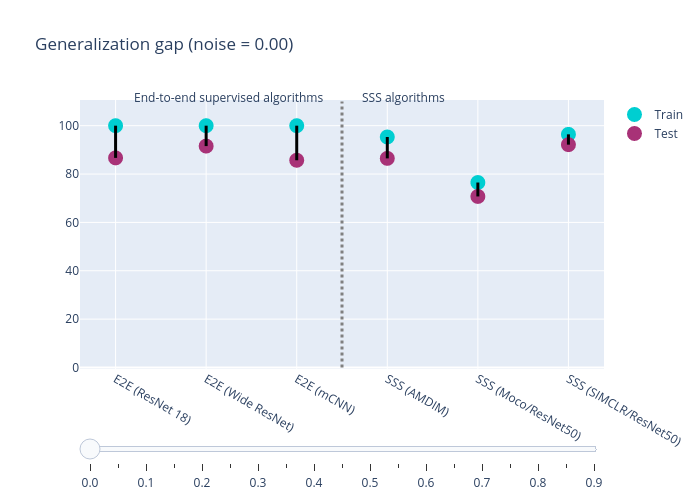
Yaminibansal's interactive graph and data of "Generalization gap (noise = 0.00)" is a scatter chart, showing Train vs Test. The x-axis shows values from 0 to 0. The y-axis shows values from 0 to 0. This visualization has the following annotations: End-to-end supervised algorithms; SSS algorithms