Edit chart
Loading graph
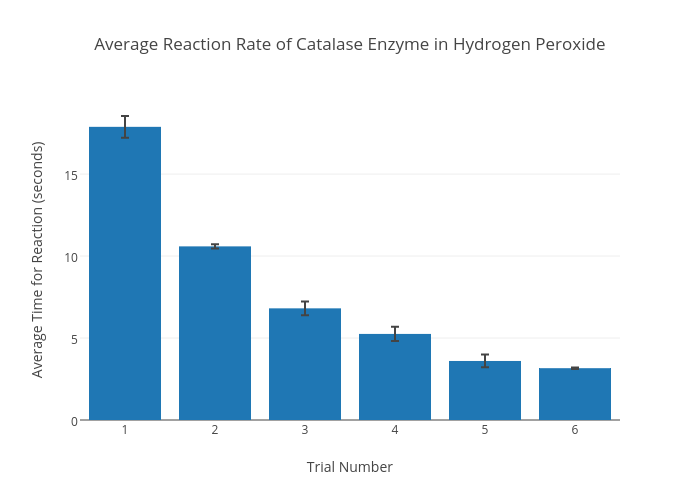
Y2016abismi's interactive graph and data of "Average Reaction Rate of Catalase Enzyme in Hydrogen Peroxide" is a bar chart, showing Col2; with Trial Number in the x-axis and Average Time for Reaction (seconds) in the y-axis.. The x-axis shows values from 0.5 to 6.5. The y-axis shows values from 0 to 19.516947368421054.