Edit chart
Loading graph
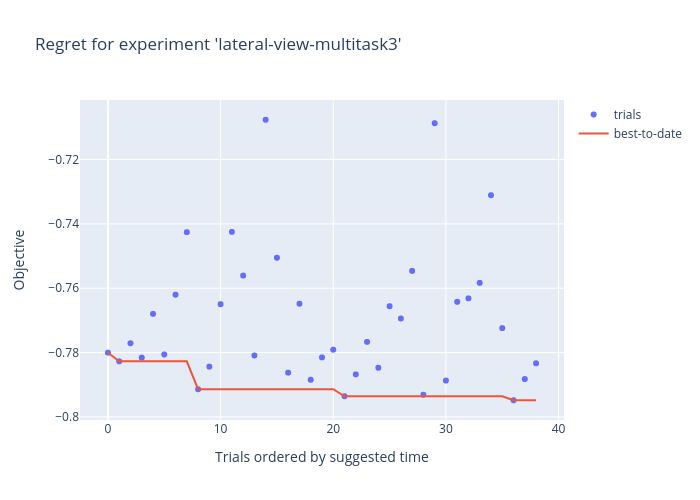
Xavier.bouthillier's interactive graph and data of "Regret for experiment 'lateral-view-multitask3'" is a scatter chart, showing trials vs best-to-date; with Trials ordered by suggested time in the x-axis and Objective in the y-axis.. The x-axis shows values from -2.7401668653158517 to 40.74016686531585. The y-axis shows values from -0.8032813970023125 to -0.6991706961038393.