Edit chart
Loading graph
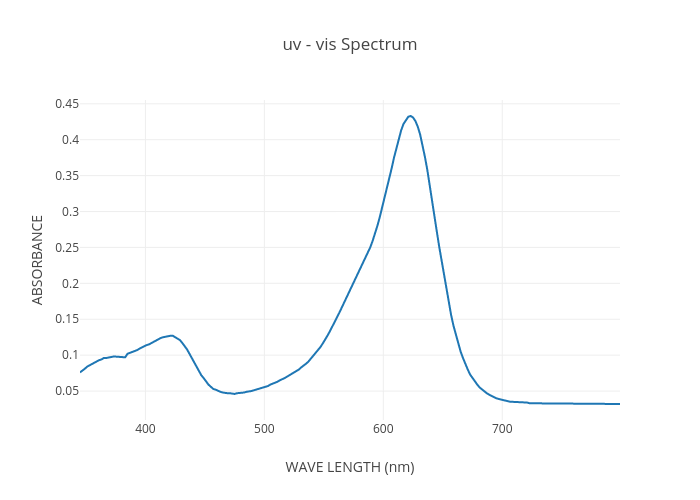
Wierdoh's interactive graph and data of "uv - vis Spectrum" is a line chart; with WAVE LENGTH (nm) in the x-axis and ABSORBANCE in the y-axis.. The x-axis shows values from 345 to 799. The y-axis shows values from 0.009722222222222222 to 0.4552777777777778.