Edit chart
Loading graph
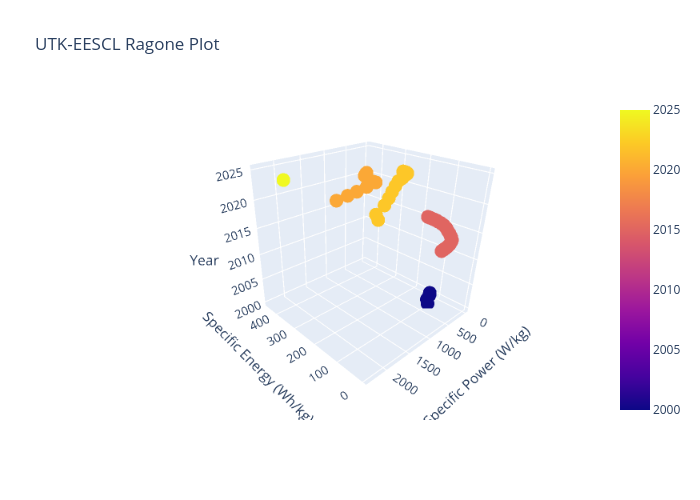
Wbuz's interactive graph and data of "UTK-EESCL Ragone Plot" is a scatter3d. The x-axis shows values from -25.305315393467215 to 480.5335637434672. The y-axis shows values from -159.11433058318417 to 2493.4387597331843.