Edit chart
Loading graph
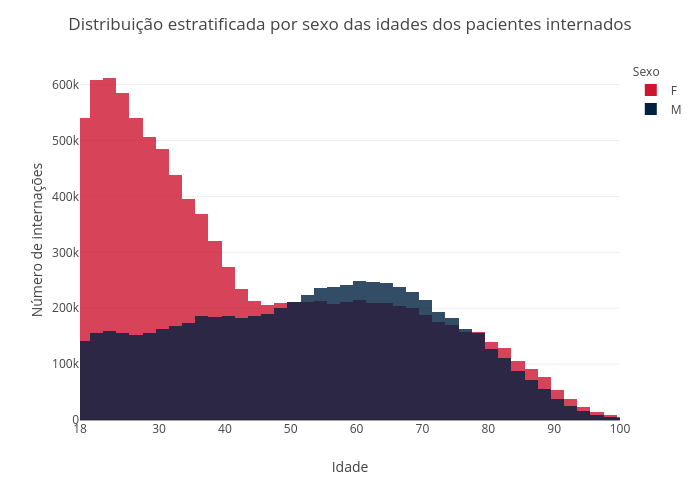
Walves's interactive graph and data of "Distribuição estratificada por sexo das idades dos pacientes internados" is a histogram, showing F vs M; with Idade in the x-axis and Número de internações in the y-axis.. The x-axis shows values from 18 to 100. The y-axis shows values from 0 to 0.