Edit chart
Loading graph
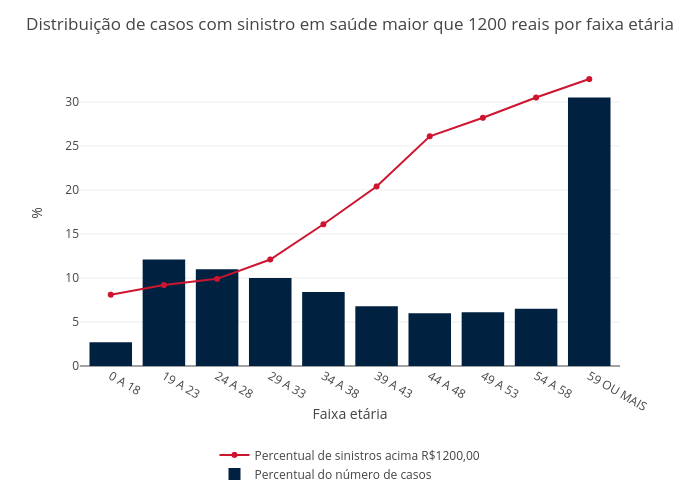
Walves's interactive graph and data of "Distribuição de casos com sinistro em saúde maior que 1200 reais por faixa etária" is a , showing Percentual de sinistros acima R$1200,00 vs Percentual do número de casos; with Faixa etária in the x-axis and % in the y-axis.. The x-axis shows values from 0 to 0. The y-axis shows values from 0 to 0.