Edit chart
Loading graph
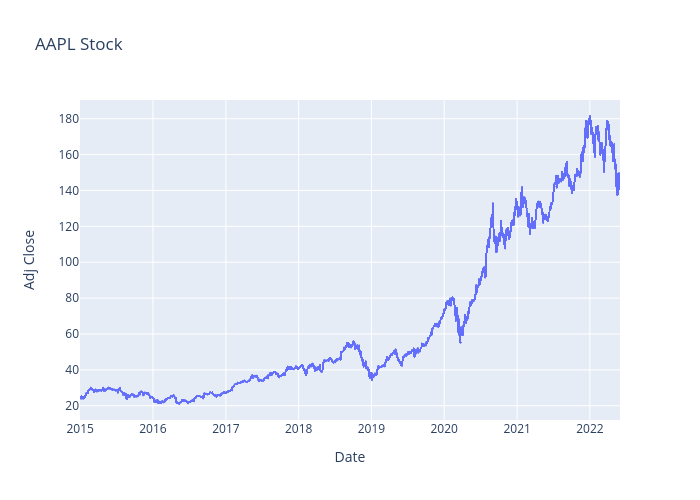
Wakame's interactive graph and data of "AAPL Stock" is a scattergl; with Date in the x-axis and Adj Close in the y-axis.. The x-axis shows values from 0 to 0. The y-axis shows values from 0 to 0.