Edit chart
Loading graph
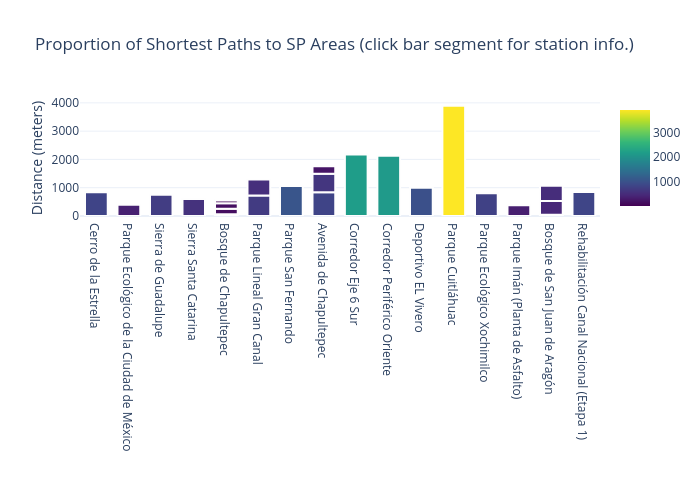
Vhriveradiaz's interactive graph and data of "Proportion of Shortest Paths to SP Areas (click bar segment for station info.)" is a bar chart, showing Shortest Path to SP Areas ; with in the x-axis and Distance (meters) in the y-axis.. The x-axis shows values from -0.5 to 15.5. The y-axis shows values from 0 to 4100.7595852631575.