Edit chart
Loading graph
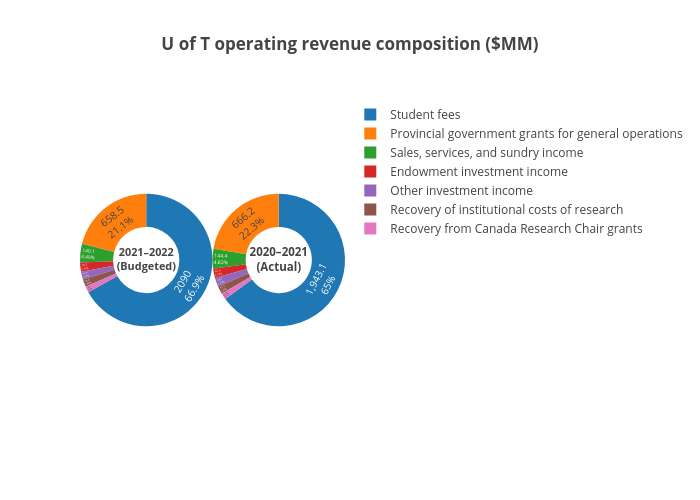
Varsity_biz's interactive graph and data of "U of T operating revenue composition ($MM)" is a pie, showing 2021–2022 vs 2020–2021. The x-axis shows values from -1 to 6. The y-axis shows values from -1 to 4.