Edit chart
Loading graph
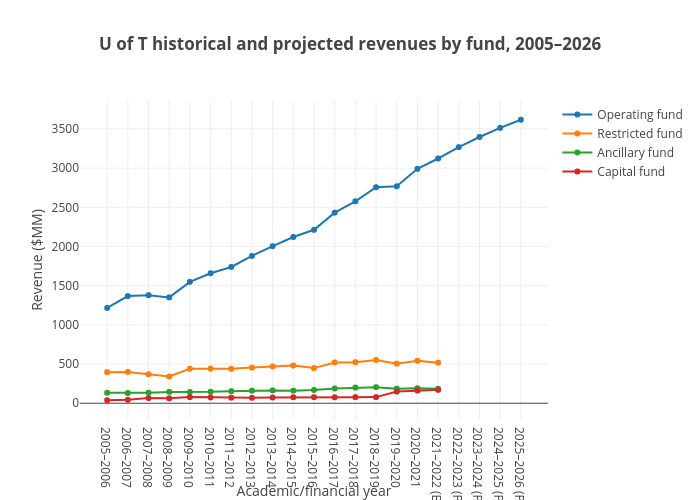
Varsity_biz's interactive graph and data of "U of T historical and projected revenues by fund, 2005–2026" is a , showing Operating fund, Restricted fund, Ancillary fund, Capital fund; with Academic/financial year in the x-axis and Revenue ($MM) in the y-axis.. The x-axis shows values from -1.161962365591398 to 20.1619623655914. The y-axis shows values from -214.14038854805727 to 3766.440388548057.