Edit chart
Loading graph
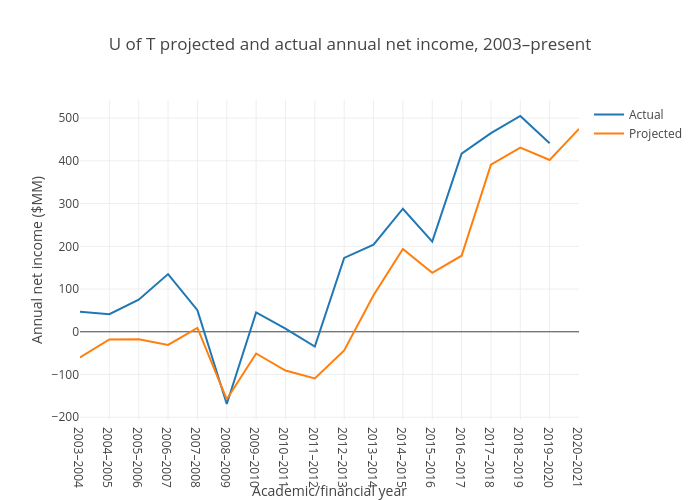
Varsity_biz's interactive graph and data of "U of T projected and actual annual net income, 2003–present" is a line chart, showing Actual vs Projected; with Academic/financial year in the x-axis and Annual net income ($MM) in the y-axis.. The x-axis shows values from 0 to 17. The y-axis shows values from -206.44444444444446 to 542.4444444444445.