Edit chart
Loading graph
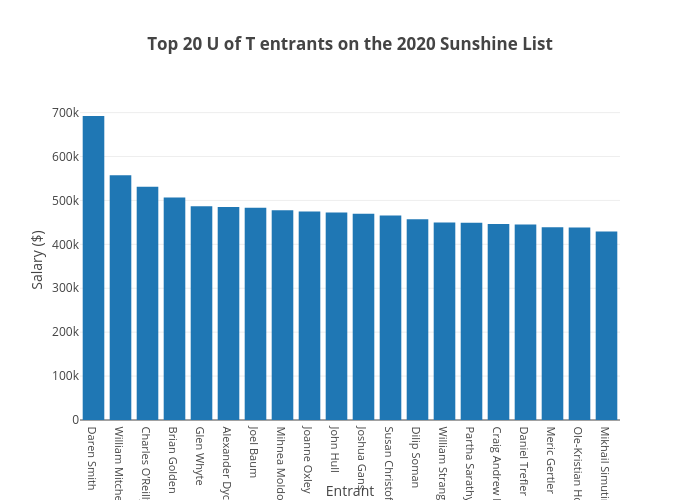
Varsity_biz's interactive graph and data of "Top 20 U of T entrants on the 2020 Sunshine List" is a bar chart; with Entrant in the x-axis and Salary ($) in the y-axis.. The x-axis shows values from -0.5 to 19.5. The y-axis shows values from 0 to 728672.5894736842.