Edit chart
Loading graph
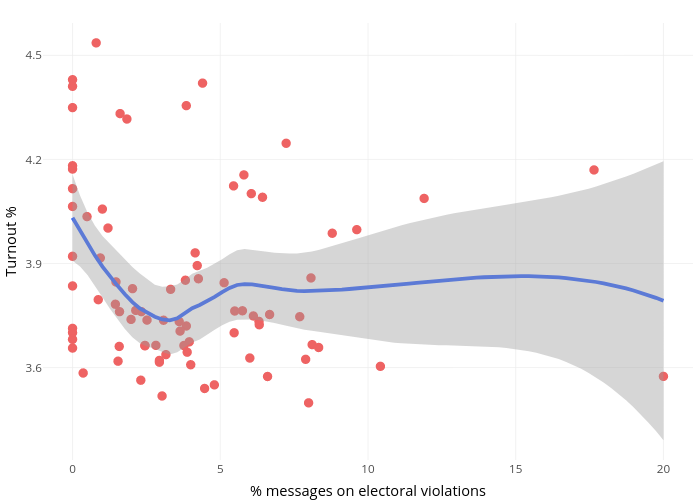
Valeria_caras's interactive graph and data of "" is a scatter chart, showing fitted values; with % messages on electoral violations in the x-axis and Turnout % in the y-axis.. The x-axis shows values from -1 to 21. The y-axis shows values from 3.3335555332609 to 4.5934076027356.