Edit chart
Loading graph
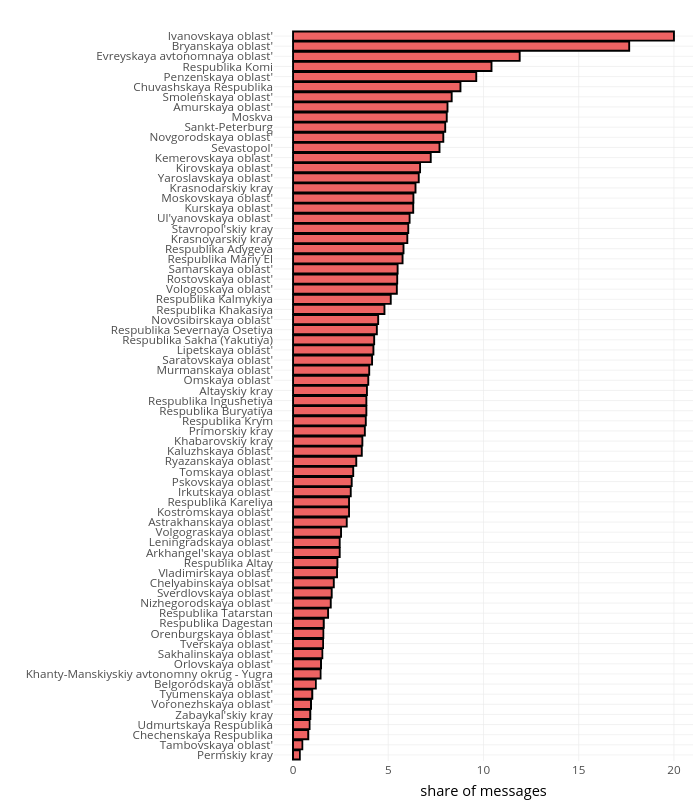
Valeria_caras's interactive graph and data of "" is a bar chart; with share of messages in the x-axis. The x-axis shows values from -1 to 21. The y-axis shows values from 0.4 to 72.6.