Edit chart
Loading graph
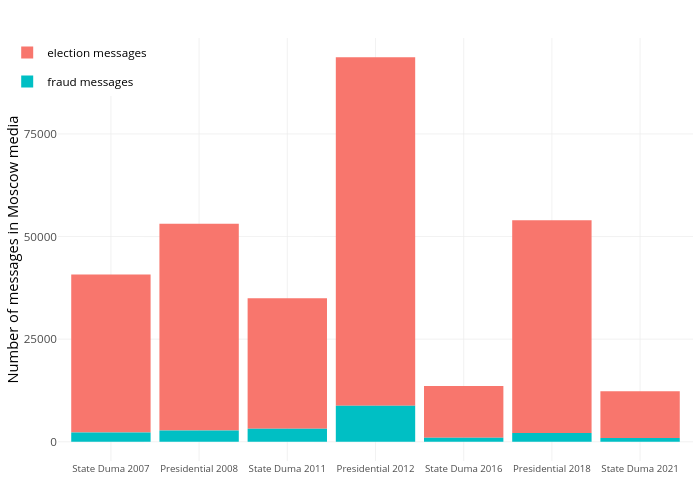
Valeria_caras's interactive graph and data of "election messages vs fraud messages" is a , showing election messages vs fraud messages; with Number of messages in Moscow media in the y-axis. The x-axis shows values from 0.4 to 7.6. The y-axis shows values from -4684.55 to 98375.55.