Edit chart
Loading graph
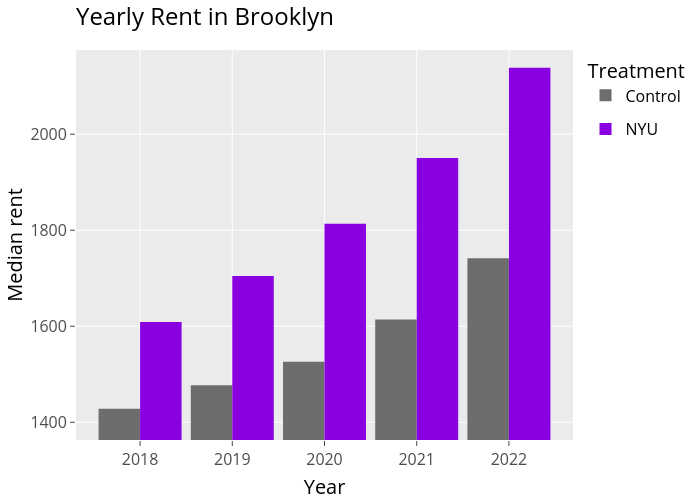
Utnosmas's interactive graph and data of "Yearly Rent in Brooklyn" is a , showing Control vs NYU; with Year in the x-axis and Median rent in the y-axis.. The x-axis shows values from 2017.3050000000003 to 2022.6949999999997. The y-axis shows values from 1363.0757692307693 to 2175.4088461538463.