Edit chart
Loading graph
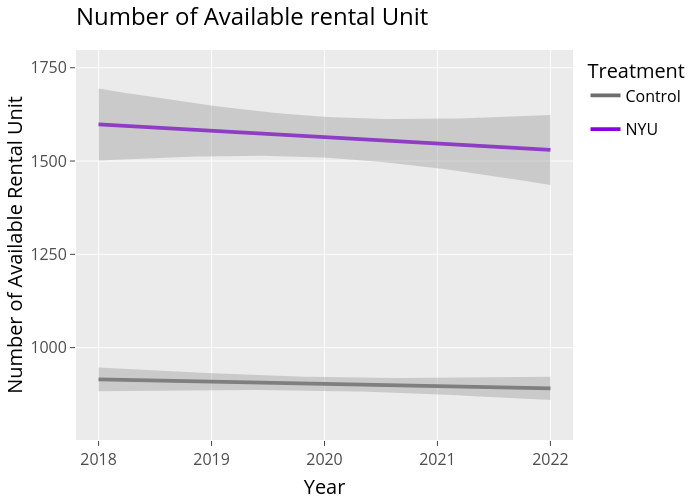
Utnosmas's interactive graph and data of "Number of Available rental Unit" is a line chart, showing Control, NYU, Control, NYU; with Year in the x-axis and Number of Available Rental Unit in the y-axis.. The x-axis shows values from 2017.8 to 2022.2. The y-axis shows values from 752.5 to 1797.5.