Edit chart
Loading graph
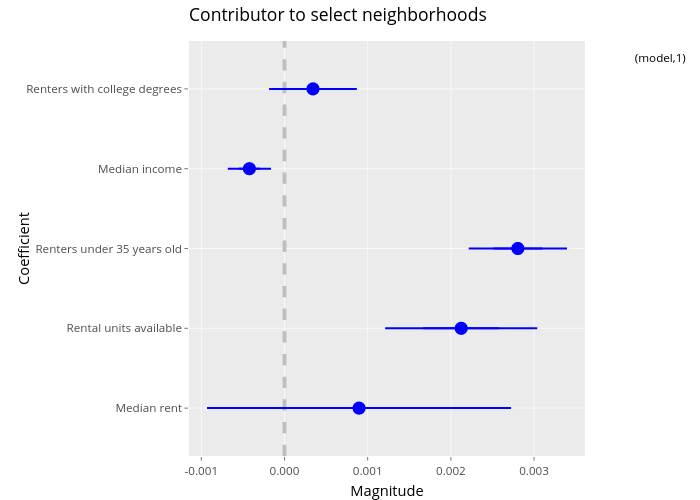
Utnosmas's interactive graph and data of "Contributor to select neighborhoods" is a line chart, showing (model,1), (model,1), (model,1); with Magnitude in the x-axis and Coefficient in the y-axis.. The x-axis shows values from -0.001147892172501819 to 0.0036126167309563327. The y-axis shows values from 0.4 to 5.6.