Edit chart
Loading graph
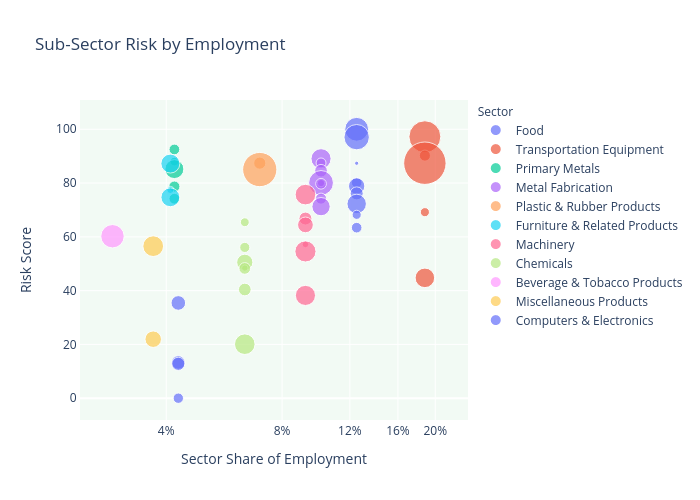
Twatson2's interactive graph and data of "Sub-Sector Risk by Employment" is a scatter chart, showing Food, Transportation Equipment, Primary Metals, Metal Fabrication, Plastic & Rubber Products, Furniture & Related Products, Machinery, Chemicals, Beverage & Tobacco Products, Miscellaneous Products, Computers & Electronics; with Sector Share of Employment in the x-axis and Risk Score in the y-axis.. The x-axis shows values from 0 to 0. The y-axis shows values from 0 to 0.